Figure 1.
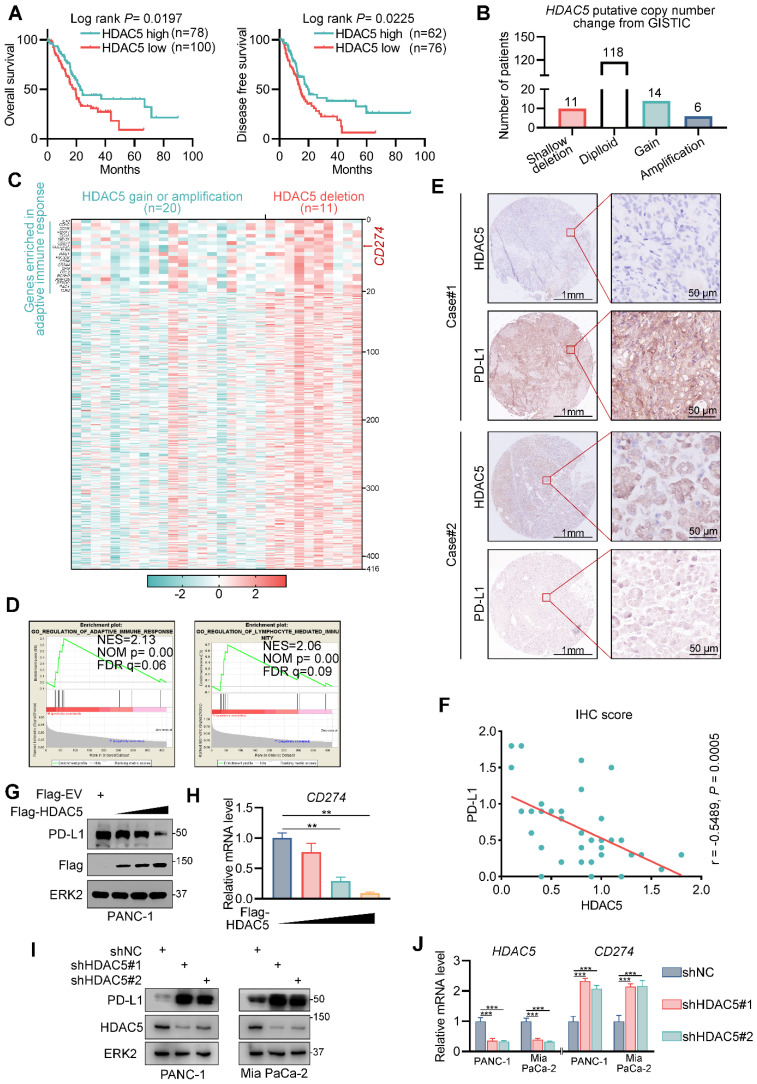
HDAC5 negatively regulates PD-L1 in pancreatic cancer. (A) Kaplan-Meier plots showing the overall survival and disease-free survival between HDAC5 high and low patients in TCGA PAAD dataset. (B) Histogram showing the distribution of HDAC5 putative copy number change from GSITIC in TCGA pancreatic cancer dataset. (C) Heatmap showing the upregulated genes in HDAC5 shallow deletion patients compared to HDAC5 gain or amplification patients (log2[fold change] > 0.1, P < 0.05). (D) GSEA output showing the most enriched pathways based on the upregulated genes in Fig. 1c. (E) Images of IHC analysis for HDAC5 and PD-L1 in PDAC patient samples (n = 35). (F) Correlation analysis of IHC staining index of HDAC5 and PD-L1 in PDAC patient specimens (n = 35). Spearman correlation coefficient and P value are shown. (G-H) PANC-1 cells were transfected with indicated plasmids in a gradient dose (0, 1, 3, 5 µg). 48 h after transfection, cells were harvested for western blot analysis (G) and RT-qPCR, data are shown as mean ± SD (n = 3, ** P < 0.01) (H). (I-J) PANC-1 and Mia PaCa-2 cells were infected with lenti-virus expressing indicated shRNA for 48 h. After 48 h puromycin selection, cells were harvested for western blot analysis (I) and RT-qPCR, data are shown as mean ± SD (n = 3, * P < 0.05, ** P < 0.01) (J).

