Figure 6.
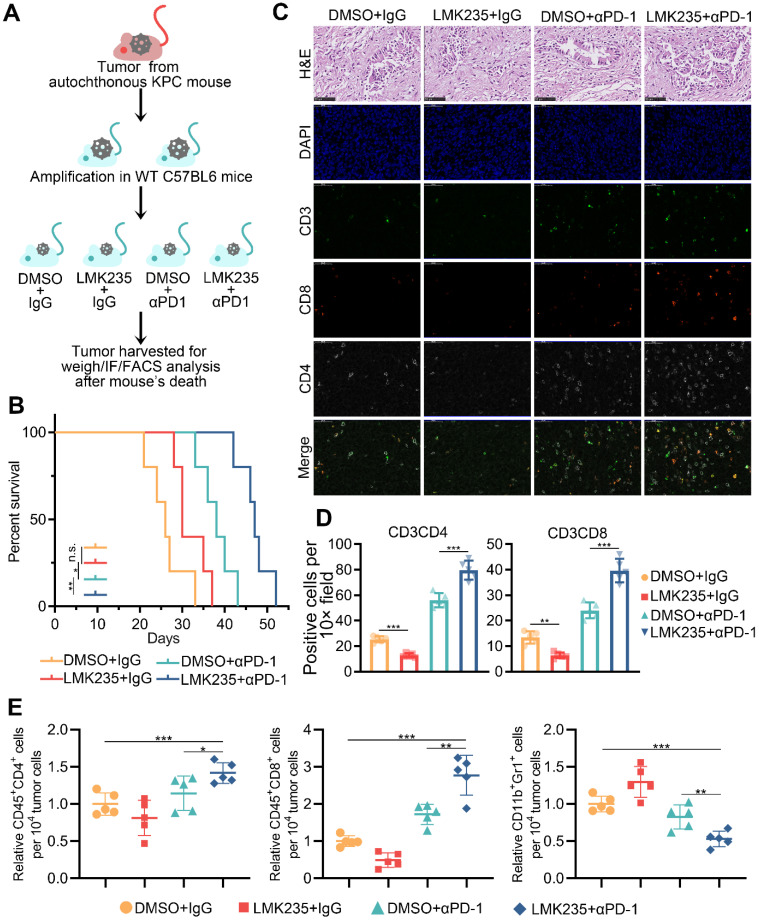
HDAC5 inhibition confers the vulnerability to anti-PD1 therapy. (A) Schematic diagram depicting the treatment plan for mice bearing KPC derived tumor. (B) Kaplan-Meier survival curves for each treatment group. * P < 0.05, ** P < 0.01 (Gehan-Breslow-Wilcoxon test). (C-D) Representative images of H&E staining and immunofluorescence staining of tumor samples in each group (C), and the quantification data (D). (E) FACS analysis of tumor infiltrated CD45+CD8+ T cells, CD45+CD4+ T cells, and CD11b+Gr1+ myeloid cells in indicated treatment group. Data are shown as mean ± SD (n = 5), * P < 0.05, ** P < 0.01, *** P < 0.001.

