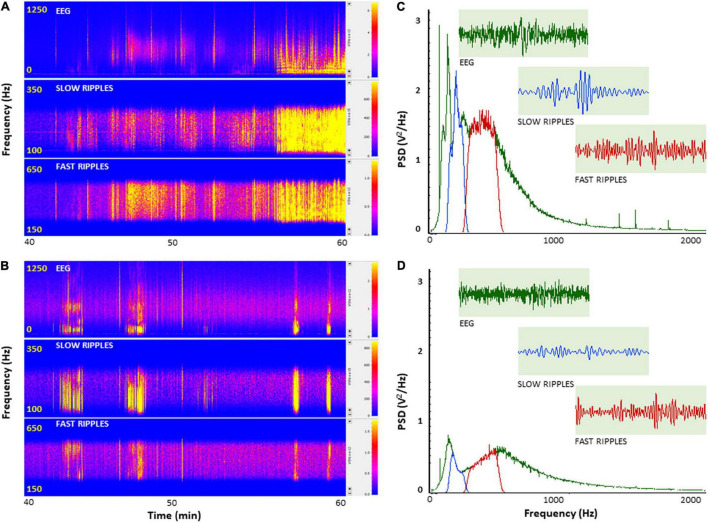
FIGURE 2.
Insulin selectively depresses cortical ripples in PH-Tau-Tg mice brains. PSDs analysis of field potential recordings from prefrontal cortex after KA injection. FFT of population spikes and filtered high frequency oscillations (HFO): slow ripples 125–250 Hz and fast ripples 250–500 Hz are shown in (C,D) with representative traces (inserts). The power density of field potentials and filtered frequencies were converted into heat maps (A,B), Controls and PH-Tau-Tg mice, respectively). (A,B) Are representative heat maps of intracerebral recording, slow ripples and fast ripples from a control mouse (A) and PH-Tau-Tg mouse (B). (C,D) Are FFT of PSDs obtained from pooled data of controls (n = 3) and PH-Tg mice (n = 3) respectively.

