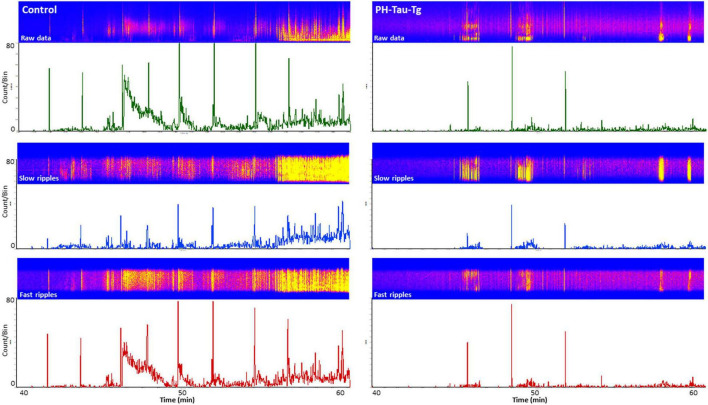
FIGURE 3.
Selective enhancement of cortical ripples after KA injections. Firing rate analysis with a detection threshold of 100 μv shows a significant increase after KA injection in controls (left) and a drastic decrease in PH-Tau-Tg mice (right). Spike histograms of filtered frequencies show a significant increase in both slow ripples [F(1) = 81.48, p < 0.001] (125–250 Hz) and fast ripples F(1) = 9.95, p < 0.001 (250–500 Hz) post KA injection in controls in presence of insulin (left panel). Insulin injection led to a significant suppression of both HFOs post KA injection. Detection threshold for slow ripples and fast ripples were 0.02 and 0.04 mv, respectively. Bin size was set to 1 s. The power density of field potentials and filtered frequencies were converted into heat maps and shown on top of the respective spike histogram (left, Controls and right, PH-Tau-Tg mice). Heat maps are representatives of a control mouse and PH-Tau-Tg mouse. Spike histograms are obtained from pooled data of controls (n = 3) and PH-Tg mice (n = 3) respectively.

