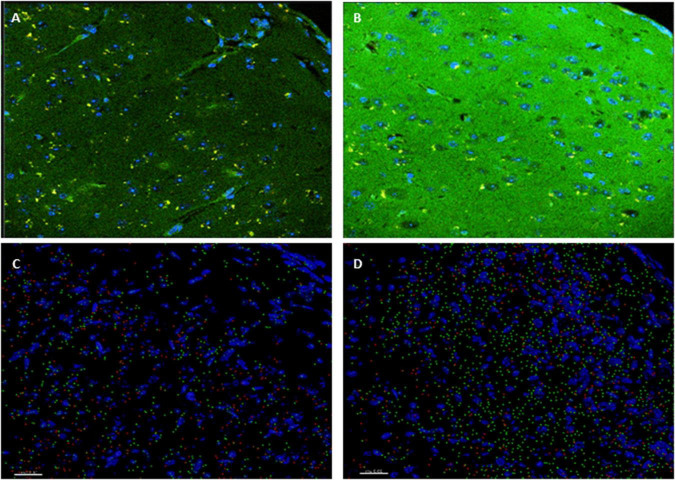
FIGURE 5.
PH-Tau-Tg mice have elevated levels of expression of activated insulin receptor and glucose transporter. (A) Control and (B) PH-Tau-Tg are representative images of a 30 μm cryosection probed with anti-p(Ser)-IRS1 (green) and anti-Glut 4 (red) showing the pattern and intensity of immunoreactivity in the cortex. DAPI (blue) was included in the mounting medium and used for nuclear localization. (C) Control and (D) PH-Tau- are Images that depict Imaris reconstructions of the z-stacks obtained with a confocal microscope of the same regions shown in (A,B). Cortex from PH-Tau-Tg mice shows a significant (p < 0.05) increase in immunoreactivity for p(Ser)-IRS1 and Glut 4. Scale bar = 20 μm.

