FIGURE 6.

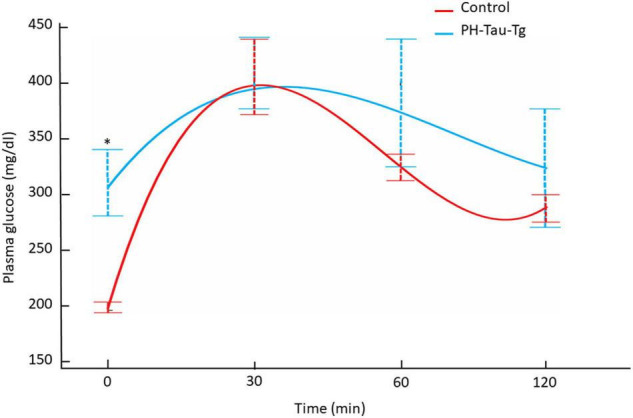
Intraperitoneal glucose tolerance test on overnight fasted control mice (n = 7) and PH-Tau-Tg mice (n = 9). Values are expressed as means ± SEM obtained from three experiments. *p < 0.05 when compared with control group.

Intraperitoneal glucose tolerance test on overnight fasted control mice (n = 7) and PH-Tau-Tg mice (n = 9). Values are expressed as means ± SEM obtained from three experiments. *p < 0.05 when compared with control group.