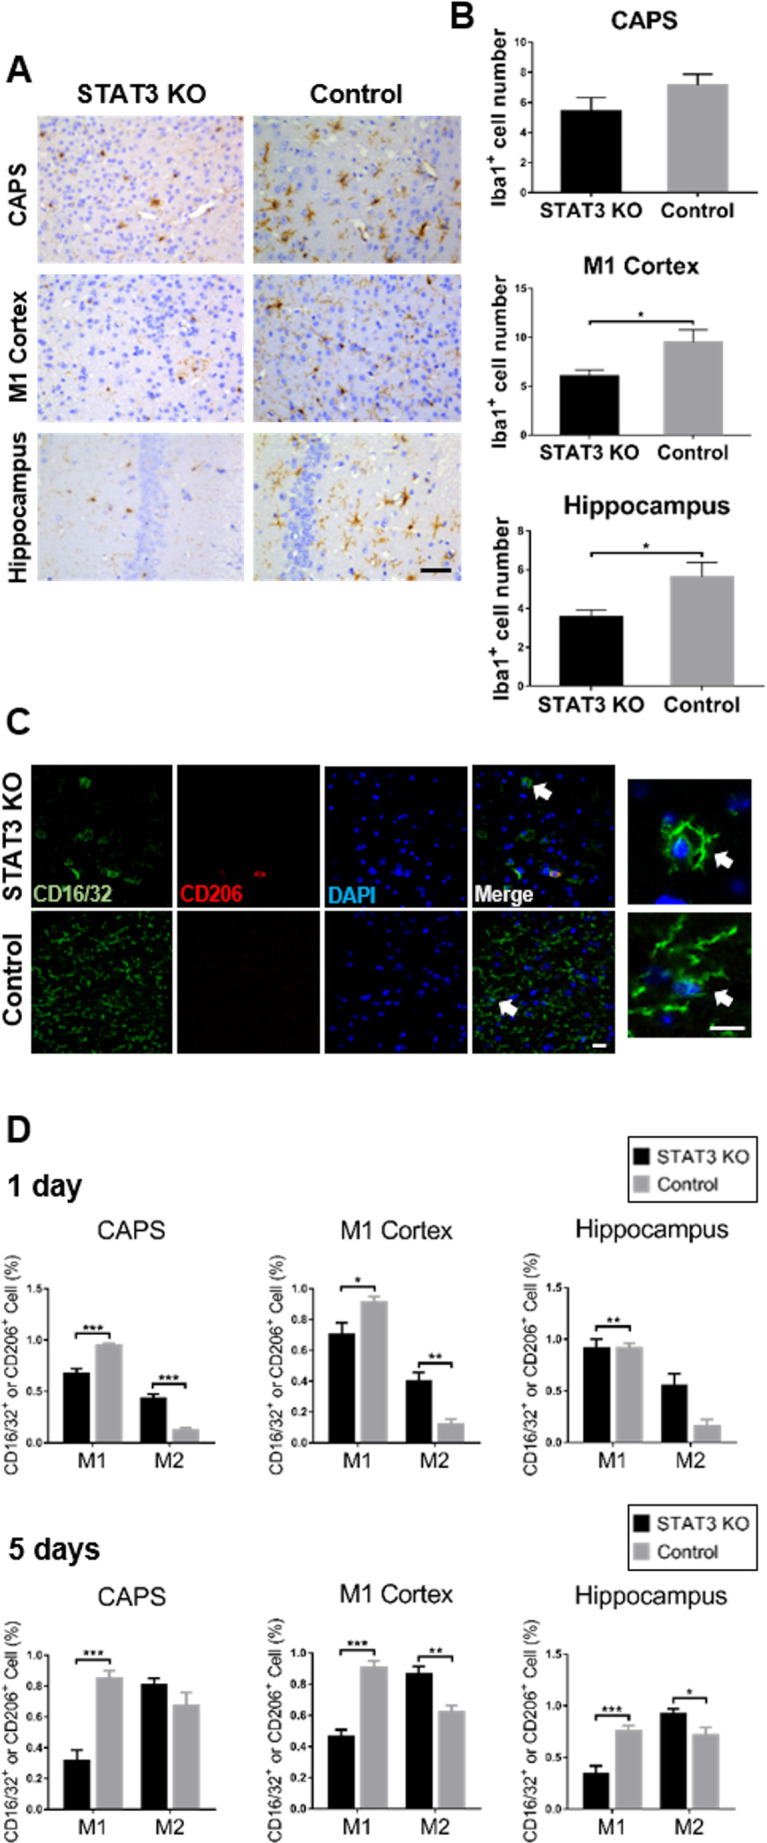
Figure 5.

Stat3 deletion primed microglia to M2 polarisation. (A) Microglia was examined by iba1 immunohistochemistry in CAPS, M1 cortex and hippocampus of the brain. The representative iba1 labelled coronal brain sections were shown on day 1 after SAH. Bar=50 µm. (B) Iba1-positive microglia were quantified in the aforementioned brain areas of STAT3 KO and control groups of mice. (C) Microglial polarisation status was determined by immunofluorescence. The representative confocal microscopic images showed the visualisation of CD16/32 (M1, green), CD206 (M2, red) and DAPI (nuclei, blue) coexpression in CAPS on day 1 after SAH. The white arrows indicate the highly magnified view of the typical microglial processes. Bar=20 µm for all magnifications. (D) CD16/32-positive (M1) or CD206-positive (M2) cells were quantified in the aforementioned brain areas of STAT3 KO and control groups of mice at 1 and 5 days after SAH. n=5–8 per group. Values were the mean±SEM. *P≤0.05, **P≤0.01, ***P≤0.001. CAPS, cortex adjacent to the perforated site; KO, knockout; SAH, subarachnoid haemorrhage; STAT3, signal transducer and activator of transcription 3.
