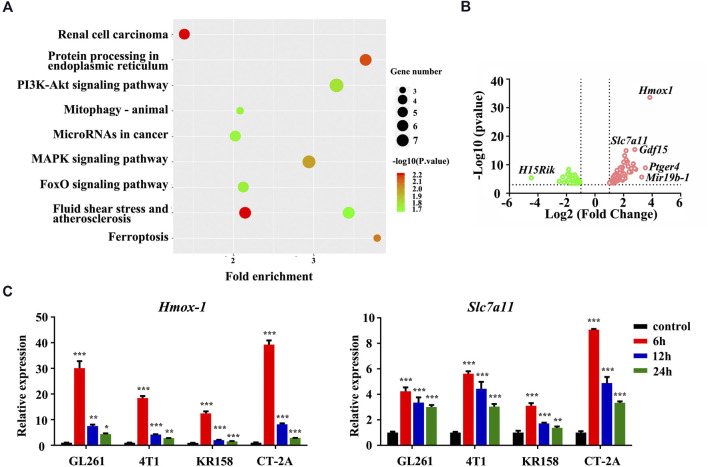
FIGURE 1.
The ferroptosis pathway was involved in 4HC-treated tumor cells. (A) Dot plots show the enriched terms identified in the KEGG analysis of differentially expressed genes detected in 4HC-treated GL261 cells compared with vehicle-treated cells, and the ferroptosis pathway was altered. (B) Volcano plot showing the upregulated and downregulated genes in response to 4HC treatment measured using RNA-seq. Solid symbols indicate genes in which the differential expression was statistically significant. Red, upregulated genes; green, downregulated genes. (C) Relative expression of the Hmox-1 and Slc7a11 mRNAs in different cell lines treated with 4HC (20 μM) for 6, 12 and 24 h. Data are presented as the means ± SD from more than three independent experiments; *p < 0.05, **p < 0.01, and ****p < 0.001 (one-way ANOVA analysis).

