FIGURE 3.
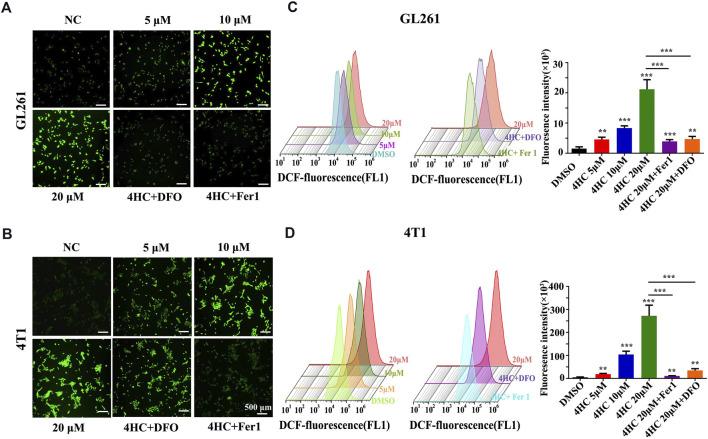
Ferroptosis inhibitors blocked 4HC-induced oxidative stress. Cultured GL261 and 4T1 cells were exposed to 4HC under the indicated conditions. (A–B) Representative images showing ROS levels in tumor cells using DFC. (C–D) Determination and quantification of the DFC fluorescence intensity using flow cytometry. Values are represented as the means ± SD from more than three independent experiments. ns, not significant, *p < 0.05, **p < 0.01, and ***p < 0.001 (one-way ANOVA analysis) for the indicated comparisons.

