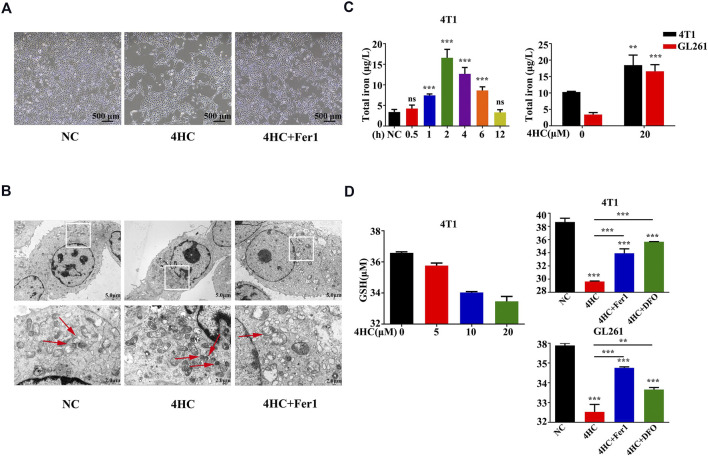
FIGURE 5.
Mitochondrial deformation and 4HC-induced alterations in GSH or iron levels were antagonized by ferroptosis inhibitors (A-B) TEM visualization of changes in mitochondrial morphology in 4T1 cells exposed to various experimental conditions. The red arrows indicate mitochondrial. Shown were representative images with similar results (scale bar = 2.0 μm). (C) Intracellular iron concentrations in 4T1 and GL261 cells exposed to 4HC (20 μM) for the indicated times were determined using ICP–MS. Values are presented as the means ± SD from three independent experiments. ns, not significant, **p < 0.01, and ***p < 0.001 (one-way ANOVA analysis). (D) Intracellular GSH levels in 4T1 and GL261 cells exposed to the indicated conditions were determined. Values are represented as the means ± SD from more than three independent experiments. **p < 0.01 and ***p < 0.001 (one-way ANOVA analysis) for the indicated comparisons.

