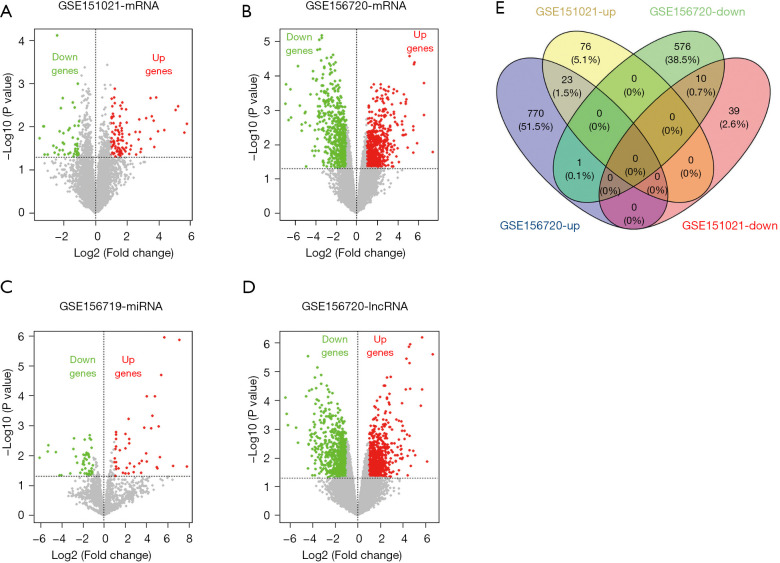
Figure 1.
Identification of overlapping DEGs. (A-D) Volcano plots of DEGs in the GSE151021, GSE156720, and GSE156719 data sets. (E) Venn diagrams of overlapping mRNAs in the GSE151021 and GSE156720 data sets. Green represents down, red represents up. DEGs, differentially expressed genes; mRNAs, messenger RNAs; lncRNA, long non-coding RNA.

