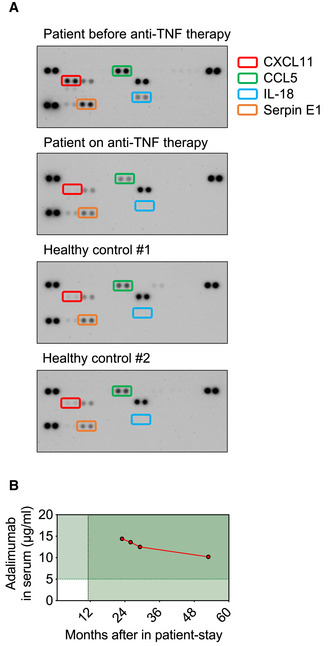
Figure EV5. The patient’s inflammatory plasma protein profile is converted to normal after treatment with the anti‐TNF therapeutic Adalimumab.

- Plasma was collected from the patient before and after start of therapy with the anti‐TNF therapeutic Adalimumab. Plasma from two healthy controls was used as comparison. The Proteome Profiler Human Cytokine Array was performed according to the manufacturer’s instructions.
- The concentration of Adalimumab in the patient’s serum is shown (target concentration: > 5 µg/ml).
