
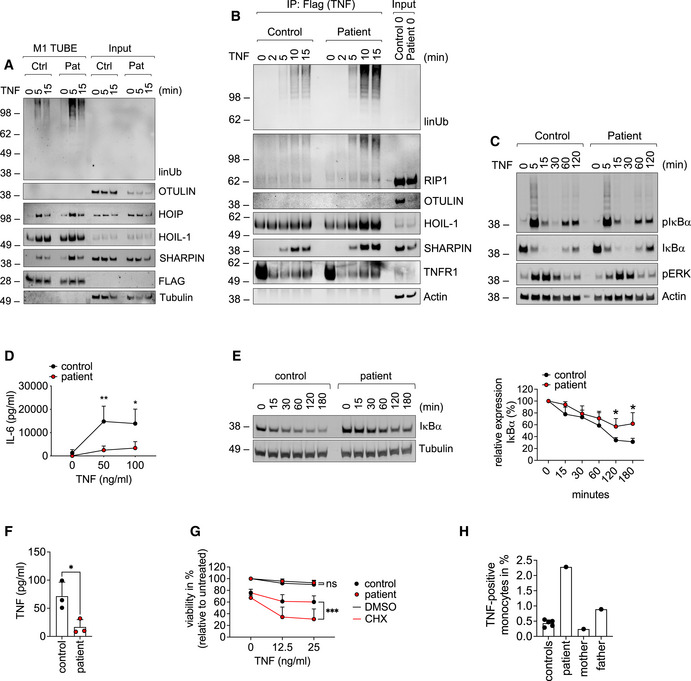
Figure 6. TNF signaling is altered in patient‐derived cells.
-
A–DPatient‐derived and control fibroblasts were used. (A) FLAG‐tagged tandem ubiquitin binding entity (TUBE) assay was performed to pull down linear ubiquitin linkages upon stimulation with 500 ng/ml TNF. (B) The TNFR1‐SC was isolated using 500 ng/ml TAP‐TNF. (C) Cells were stimulated with 100 ng/ml TNF for the indicated times and analyzed by Western blot. One representative (A–C) of three independent experiments is shown. (D) Cells were stimulated with TNF for 24 h and IL‐6 was determined by ELISA. Data are presented as mean ± SD of three individual experiments performed in two technical replicates; *P = 0.014; **P = 0.007; multiple t‐test corrected for multiple comparisons using the Holm–Sidak method.
-
EB cells were incubated with 50 µg/ml cycloheximide (CHX) for the indicated times and subjected to analysis by Western blot. One representative (left panel) out of 4 individual experiments analyzed by densitometry (right panel) is shown. Data are presented as mean ± SD. *P = 0.02, unpaired t‐test.
-
FPatient‐derived and control B cells were cultivated for 24 h and TNF was determined by ELISA. Data are presented as mean ± SD of 3 individual experiments performed in two technical replicates; *P = 0.028; unpaired t‐test.
-
GFibroblasts were incubated with 50 µg/ml cycloheximide (CHX) or DMSO and stimulated with TNF as indicated. Viability was measured after 24 h. Data are presented as mean ± SD of 5 individual experiments performed in three technical replicates; ***P = 0.0008, mixed‐effects analysis with Tukey’s multiple comparisons test.
-
HIntracellular TNF in CD11b‐positive cells from five healthy controls, patient (before anti‐TNF treatment), mother, and father was determined by FACS.
Source data are available online for this figure.