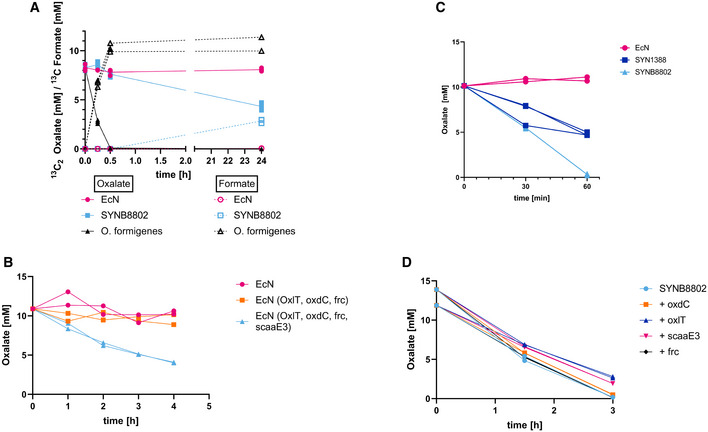
SYNB8802 vs. Oxalobacter formigenes. Left y‐axis: 13C2‐oxalate in mM, 13C‐formate in mM, x‐axis: time in hours. Oxalobacter formigenes (black, triangle, solid line: oxalate, dotted line: formate). SYNB8802 (light blue, square, solid line: oxalate, dotted line: formate). The control EcN (pink, circle, solid line: oxalate, dotted line: formate). Biological triplicates were run and plotted separately.
Scaae3 is needed for oxalate degradation in EcN. Y‐axis shows oxalate in mM. X‐axis: time in hours. Wild type EcN (pink, circle). EcN expressing the OF genes oxdC, oxlT, and frc on p15a (orange, square). EcN expressing the OF genes including scaaE3 on p15a (light blue, triangle). Biological duplicates were run and plotted separately.
SYNB8802 vs. SYN1388. Y‐axis shows oxalate in mM. X‐axis: time in minutes. Wild type EcN (pink, circle). Prototype strain SYN1388 (blue, square). SYNB8802 (light blue, triangle). Biological duplicates were run and plotted separately.
Overexpression of individual pathway components. Y‐axis shows oxalate in mM. X‐axis: time in hours. SYNB8802 (blue, circle). SYNB8802, with added plasmid‐based expression of oxdC (orange, square). SYNB8802, with added plasmid‐based expression of oxlT (blue, triangle). SYNB8802, with added plasmid‐based expression of scaaE3 (pink, triangle). SYNB8802, with added plasmid‐based expression of frc (black, diamond). Biological duplicates were run and plotted separately.

