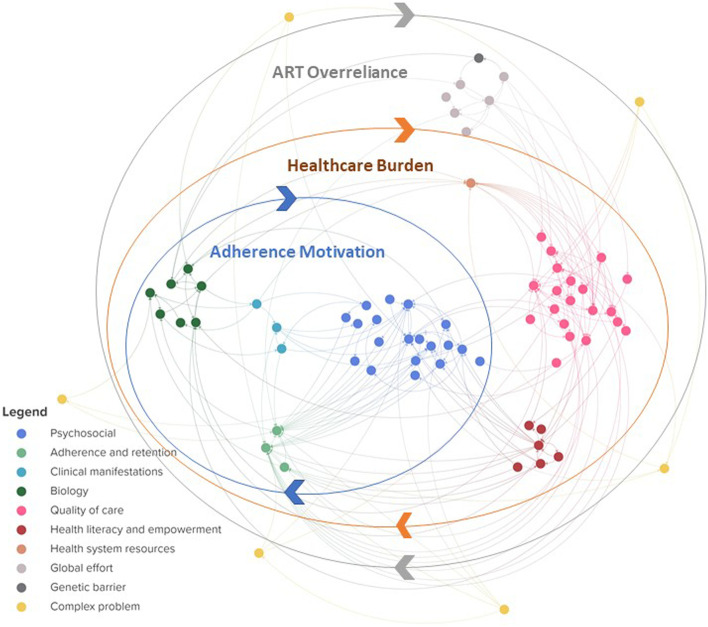
Fig. 2.
Clustered systems map visualizing three interconnected subsystems. Each cluster of elements is represented in a different colour, corresponding to the colours used in Fig. 3 and connects elements related to a certain theme. Note that all elements and connections represented here are the same as the ones presented in Additional file 1 but organized in clusters instead of in layers. Three main subsystems are indicated in the blue, orange and grey overlaying circles. An interactive overview this map, can be found in Additional file 3 ([27], page 1])

