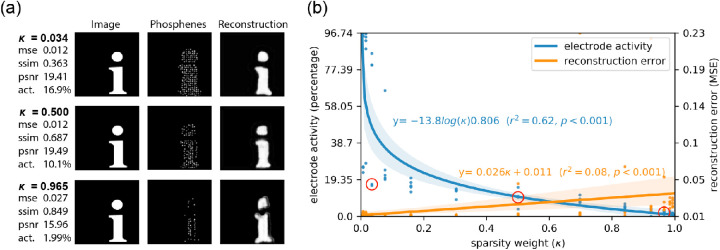
Figure 4.
Results of Experiment 2. The model was trained on a combination of mean squared error loss and sparsity loss. The 13 different values for sparsity weight κ were tested. (a) Visualization of the results for three out of the 13 values for κ. Each row displays the performance metrics for the best-performing model out of five random restarts, and one input image from, the validation dataset (left), with the corresponding simulated phosphene representation (middle) and reconstruction (right). (b) Regression plot displaying the sparsity of electrode activation and the reconstruction error in relation to the sparsity weight κ. The red circles indicate the best-performing model for the corresponding sparsity condition, as visualized in panel a.

