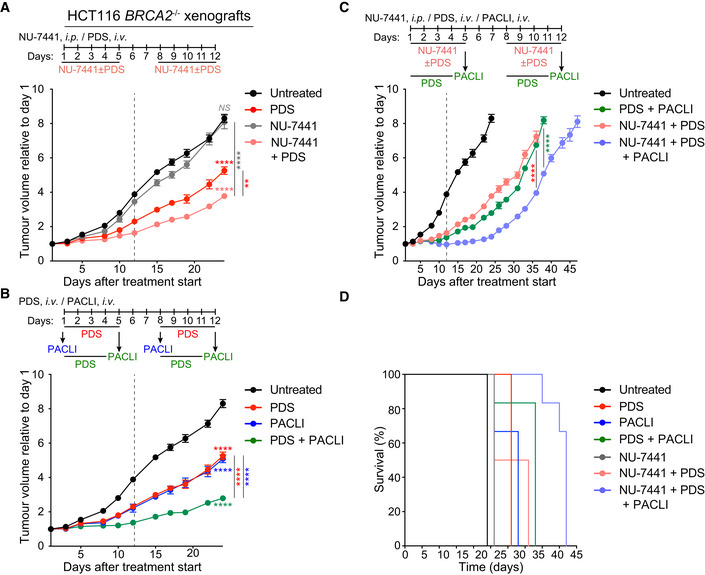
Figure 6. Antitumoral effect of pyridostatin, NU‐7441 and paclitaxel combinations in BRCA2‐deficient HCT116 xenograft models.

BRCA2‐deficient HCT116 human cells were injected intramuscularly in SCID male mice.
- Pyridostatin (PDS) was administered intravenously (i.v.; 7.5 mg/kg/day) and NU‐7441 was administered intraperitoneally (i.p.; 10 mg/kg/day), over the indicated periods of time. Vertical dashed line indicates end of treatment. Tumour volume was measured at the timepoints shown on the graph and expressed relative to tumour volume at the beginning of treatment. Each experimental group included n = 6 mice. Error bars represent SEM. P values were calculated at day 24 using an unpaired two‐tailed t‐test NS, P > 0.05; **P ≤ 0.01; ****P ≤ 0.0001.
- Pyridostatin (PDS) was administered intravenously (i.v.; 7.5 mg/kg/day) over the indicated periods of time, and paclitaxel (PACLI) was administered intravenously (i.v.; 20 mg/kg/day) on indicated single days. Vertical dashed line indicates end of treatment. Tumour volume was measured at the timepoints shown on the graph and expressed relative to tumour volume at the beginning of treatment. Each experimental group included n = 6 mice. Error bars represent SEM. P values were calculated at day 24 using an unpaired two‐tailed t‐test ****, P ≤ 0.0001.
- Pyridostatin (PDS) was administered intravenously (i.v.; 7.5 mg/kg/day), NU‐7441 was administered intraperitoneally (i.p.; 10 mg/kg/day), over the indicated periods of time, and paclitaxel (PACLI) was administered intravenously (i.v.; 20 mg/kg/day) on indicated single days. Vertical dashed line indicates end of treatment. Tumour volume was measured at the timepoints shown on the graph and expressed relative to tumour volume at the beginning of treatment. Each experimental group included n = 6 mice. Error bars represent SEM. P values were calculated at day 36 or 38 using an unpaired two‐tailed t‐test ****, P ≤ 0.0001.
- Kaplan‐Meier survival curve for mice treated as in (C), with each treatment group containing n = 6 mice. Statistical significance was assessed by Log‐rank test (****P < 0.0001).
Data information: Exact P values for (A‐C) are provided in Appendix Table S8 and (D) in Appendix Table S6.
