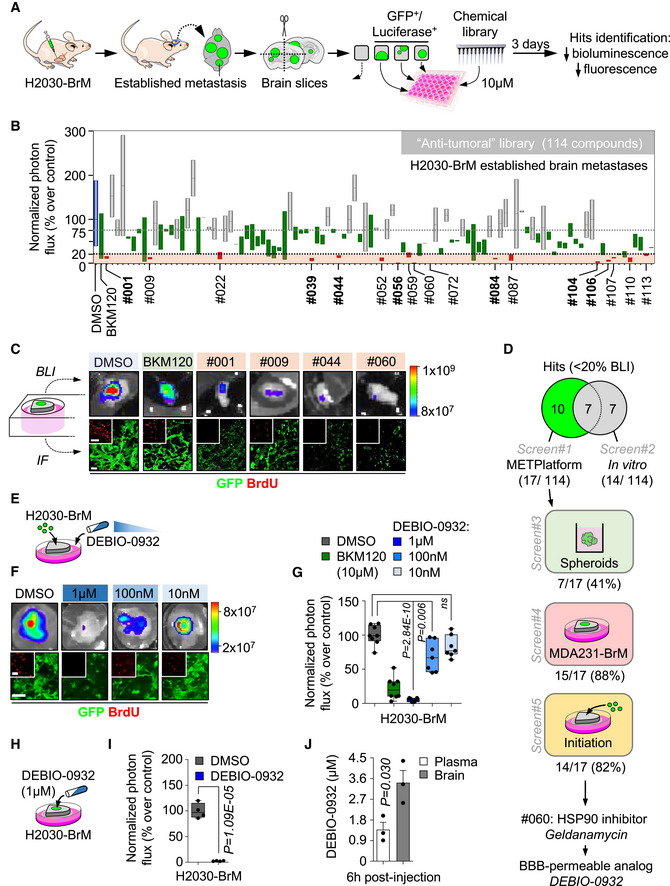
Figure 1. A chemical library applied to METPlatform identifies potential vulnerabilities of brain metastasis.

- Schema of the experimental design.
- Quantification of the bioluminescence signal emitted by established H2030‐BrM brain metastases in each organotypic culture at day 3 normalized by their initial value at day 0 (before the addition of DMSO or any compound). The final value in the graph is normalized to the organotypic cultures treated with DMSO. Blue: DMSO‐treated organotypic cultures; red: hits, compounds with normalized BLI ≤ 20%; green: BKM120 and compounds with similar efficacy to BKM120; gray: compounds that do not reduce BLI values. Values are shown in box‐and‐whisker plots where the line in the box corresponds to the mean. Boxes extend from the minimum to the maximum value (n = 28 DMSO; n = 21 BKM120‐treated organotypic cultures; each experimental compound of the library was assayed by duplicate, 8 independent experiments). Hits highlighted in bold are common to those obtained in the in vitro screening (Fig EV1A). Gray dashed line indicates the minimum decrease in BLI (25%) that we considered as a positive phenotype. The black dashed line represents 80% decrease in BLI, which identifies top hits.
- Representative images of bioluminescence (BLI) and histology of organotypic cultures with established brain metastases from H2030‐BrM treated with DMSO, BKM120 or the indicated hits. Cancer cells are in green (GFP) and proliferative cells are in red (BrdU). Scale bar: 75 µm.
- Venn diagram showing the number of hits ex vivo (17) and in vitro (14) and common to both approaches (7). Compounds tested in additional screens (screen#3: H2030‐BrM spheroids; screen#4: established MDA231‐BrM breast cancer brain metastasis; and screen#5: metastasis initiation H2030‐BrM) only include those considered as hits ex vivo in panel B. Number of hits in each screen are indicated over the total number of hits obtained in screen#1 (B).
- Schema of the experimental design. Organotypic cultures with H2030‐BrM cells mimicking the early steps of colonization were used to perform dose‐response optimization with DEBIO‐0932.
- Representative BLI and histology of organotypic cultures with H2030‐BrM cancer cells treated with DMSO or decreasing concentrations of DEBIO‐0932. Scale bar: 100 µm; high magnification: 50 µm.
- Quantification of the bioluminescence signal emitted by each condition shown in (F) at Day 3 normalized by the initial value obtained at Day 0 and normalized to the organotypic cultures treated with DMSO. Day 0 is considered 12–16 h after the addition of cancer cells and treatment or DMSO. Values are shown in box‐and‐whisker plots where each dot is an organotypic culture and the line in the box corresponds to the median. The boxes go from the upper to the lower quartiles and the whiskers go from the minimum to the maximum value (n = 8 DMSO, n = 8 BKM120 and n = 7 per concentration of DEBIO‐0932‐treated organotypic cultures, 2 independent experiments). P value was calculated using two‐tailed t‐test.
- Schema of the experimental design. Organotypic cultures with H2030‐BrM established metastases were used to test the efficacy of DEBIO‐0932.
- Quantification of the bioluminescence signal emitted by H2030‐BrM established metastases in organotypic cultures at Day 3 normalized by the initial value obtained at Day 0 and normalized to the organotypic cultures treated with DMSO. Day 0 is considered right before addition of the treatment or DMSO. Values are shown in box‐and‐whisker plots where each dot is an organotypic culture and the line in the box corresponds to the median. The boxes go from the upper to the lower quartiles and the whiskers go from the minimum to the maximum value (n = 4 organotypic cultures per experimental condition, 2 independent experiments). P value was calculated using two‐tailed t‐test.
- Quantification of the concentration of DEBIO‐0932 reached in animals harboring H2030‐BrM established brain metastases 6 h after oral administration of DEBIO‐0932 at 160 mg/kg. The concentration was measured in both the plasma and the brain for each mouse. Values are shown as mean + s.e.m. (n = 3 mice per experimental condition). P value was calculated using two‐tailed t‐test.
