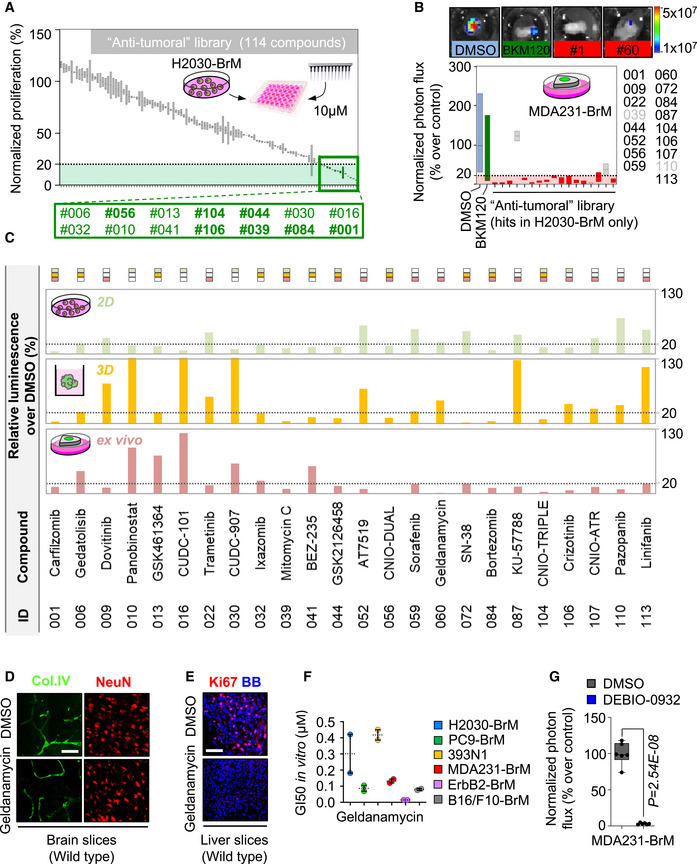
Figure EV1. A chemical library applied to METPlatform identifies potential vulnerabilities of brain metastasis.

- Quantification of the proliferation of H2030‐BrM cells at day 3 normalized to the cells treated with DMSO measured with CellTiter‐Glo®. Green: hits, compounds with ≤ 20% proliferation; gray: compounds with > 20% proliferation. Values are shown in box‐and‐whisker plots where the line in the box corresponds to the mean. Each experimental compound of the library was assayed by duplicate. Hits highlighted in bold were common to the ex vivo screening (Fig 1B).
- Quantification of the bioluminescence signal from MDA231‐BrM established brain metastases in organotypic culture after 3 days in culture. Values were normalized by the level of bioluminescence at Day 0 for each culture (before the addition of DMSO or any compound). Final data is shown in percentage respect to reference, the organotypic cultures treated with DMSO. Blue: DMSO‐treated organotypic cultures; red: hits, compounds with normalized BLI ≤ 20% (dashed line); green: BKM120; gray: compounds with normalized BLI > 20%. Values are shown in box‐and‐whisker plots where the line in the box corresponds to the mean. Boxes extend from the minimum to the maximum value (n = 14 DMSO; n = 13 BKM120‐treated organotypic cultures; each experimental compound was assayed by duplicate, 4 independent experiments).
- Detailed representation of the data shown in Figs 1B, EV1A and Table EV1 indicating relative viability using bioluminescence generated by H2030‐BrM cells ex vivo (established brain metastases, light red), in vitro 2D (green) and in vitro 3D (spheroids, yellow) treated with compounds of the anti‐tumoral library (compounds were assayed by duplicate in each assay). All hits for any condition are shown. The rectangles of the top indicate whether a given compound was effective (< 20% luminescence respect to control) ex vivo (light red rectangle), in vitro 2D (green rectangle), in vitro 3D (yellow rectangle).
- Representative wild‐type brain slices treated with DMSO or the HSP90 inhibitor geldanamycin stained with anti‐Col.IV (endothelial cells) and anti‐NeuN (neurons). Scale bar: 50 µm.
- Representative wild‐type liver slices treated with DMSO or the HSP90 inhibitor geldanamycin and stained with anti‐Ki67 to score proliferation. BB: bisbenzamide. Scale bar: 50 µm.
- Quantification of GI50 values of geldanamycin in a panel of BrM cell lines in vitro from various primary origins and oncogenomic profiles. Nine serial concentrations of geldanamycin were assayed by duplicate and GI50 was calculated from a viability curve normalized to DMSO‐treated cells of the corresponding cell line. Values are shown as mean + s.e.m. (each concentration was assayed by technical duplicates for each cell line and the experiment was performed twice).
- Quantification of the bioluminescence signal emitted by MDA231‐BrM established metastases in organotypic cultures incubated in the presence of DEBIO‐0932 (1 µM) during 3 days. Bioluminescence at Day 3 is normalized by the initial value obtained at day D and quantified relative to the organotypic cultures treated with DMSO. Day 0 is considered right before addition of the treatment or DMSO. Values are shown in box‐and‐whisker plots where each dot is an organotypic culture and the line in the box corresponds to the median. The boxes go from the upper to the lower quartiles and the whiskers go from the minimum to the maximum value (n = 6 organotypic cultures per experimental condition, 1 experiment). P value was calculated using two‐tailed t‐test.
