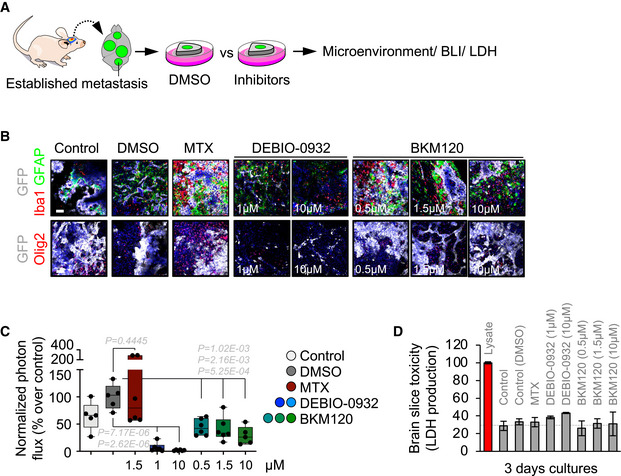
Figure 2. METPlatform is compatible with the evaluation of the metastasis‐associated microenvironment.

- Schema of the experimental design.
- Representative images of organotypic cultures with established metastases with various glial components of the microenvironment labeled. Scale bar: 75 µm. Each individual condition was evaluated in several organotypic cultures (3–6 slices).
- Quantification of the bioluminescence signal emitted by established H2030‐BrM brain metastases in each organotypic culture at Day 3 normalized by their initial value at Day 0 (before the addition of DMSO or any compound). The final value in the graph is normalized to the organotypic cultures treated with DMSO. Values are shown in box‐and‐whisker plots where the line in the box corresponds to the mean. The boxes go from the upper to the lower quartiles and the whiskers go from the minimum to the maximum value (n = 5–6 organotypic cultures, 1 independent experiment). P value was calculated using two‐tailed t‐test.
- Quantification of LDH levels in the conditioned media of organotypic slices cultured during 3 days relative to a lysate of the same preparation. Values are shown as mean + s.e.m. (n = 3 organotypic cultures per experimental condition, 1 independent experiment).
