-
A
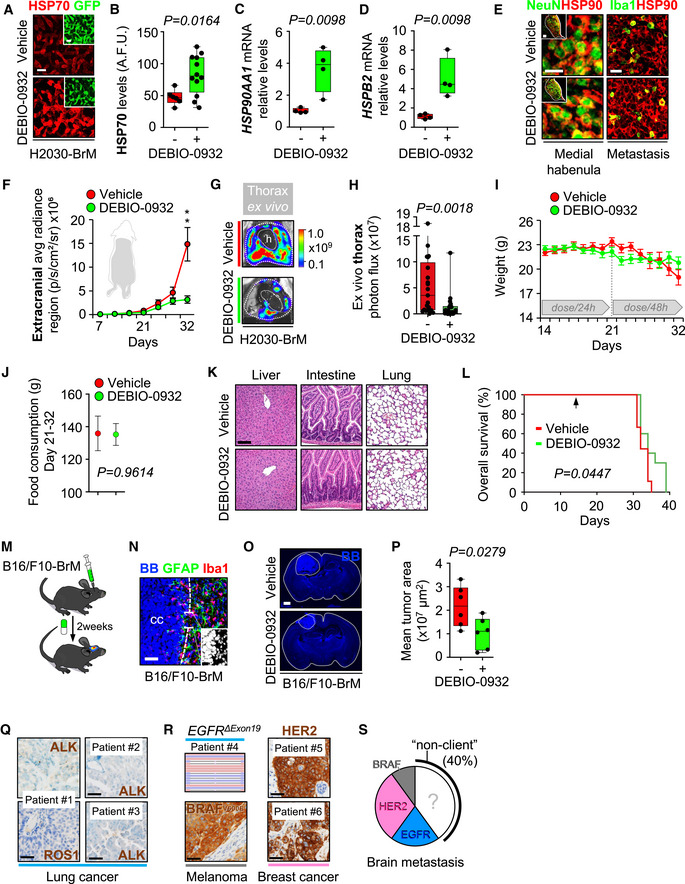
Representative images showing HSP70 levels in brain metastases (generated by intracardiac inoculation of H2030‐BrM) found at endpoint of vehicle and DEBIO‐0932‐treated animals. Scale bar: 75 µm.
-
B
Quantification of HSP70 levels shown in (A) in arbitrary fluorescent units (A.F.U.). Values are shown in box‐and‐whisker plots where each dot is a metastatic lesion and the line in the box corresponds to the median. The boxes go from the upper to the lower quartiles, and the whiskers go from the minimum to the maximum value (n = 6–12 metastatic lesions from 3 to 6 brains per condition). P value was calculated using two‐tailed t‐test.
-
C, D
HSP90AA1 (C) and HSPB2 (D) expression levels obtained by qRT–PCR of H2030‐BrM brain metastases obtained at endpoint of vehicle and DEBIO‐0932‐treated animals. Values are shown in box‐and‐whisker plots where every dot represents a different animal and the line in the box corresponds to the median. The boxes go from the upper to the lower quartiles, and the whiskers go from the minimum to the maximum value (n = 4 mice per experimental condition). P value was calculated using two‐tailed t‐test.
-
E
Representative images of HSP90
+ non‐cancer cell compartments including the medial habenula and the Iba1
+ microglia/macrophages in the metastasis‐associated microenvironment from vehicle and DEBIO‐0932‐treated brains at the endpoint of the experiment (Fig
4A). Scale bars: Medial habenula low magnification (nucleus): 50 µm; Medial habenula high magnification (cells): 12.5 µm; Metastasis: 32 µm.
-
F
Quantification of metastatic progression as measured by in vivo BLI of extracranial region of animals. Values are shown as mean ± s.e.m. (n = 23 vehicle and n = 25 DEBIO‐0932‐treated mice, 3 independent experiments). P value was calculated using two‐tailed t‐test (P values: **P < 0.01).
-
G
Representative images of thorax from vehicle and DEBIO‐0932‐treated mice at the endpoint of the experiment.
-
H
Quantification of ex vivo BLI of thoracic regions at the endpoint of the experiment. Values are shown in box‐and‐whisker plots where every dot represents a different animal and the line in the box corresponds to the median. The boxes go from the upper to the lower quartiles, and the whiskers go from the minimum to the maximum value. (n = 21 vehicle and n = 24 DEBIO‐0932‐treated mice, three independent experiments). P value was calculated using two‐tailed t‐test.
-
I
Animal weight from vehicle and DEBIO‐0932‐treated mice during the treatment period. DEBIO‐0932 treatment started 2 weeks (day 14) after inoculation of cancer cells and was maintained for 3 weeks, once every 24 h during the first week and once every 48 h during the two following weeks. Values are shown as mean ± s.e.m. (n = 9 vehicle and n = 10 DEBIO‐0932‐treated mice).
-
J
Quantification of mean food consumption during the interval of time between 21 and 32 days in both vehicle and DEBIO‐0932‐treated mice. Values are shown as mean ± s.e.m. (n = 6 mice per experimental condition. Mice were divided in two individual cages per experimental condition with 3 mice each). P value was calculated using two‐tailed t‐test.
-
K
Hematoxylin eosin staining of three organs from vehicle and DEBIO‐0932‐treated mice at experimental endpoint. (n = 3 mice per experimental condition were evaluated for each organ). Scale bar: 50 µm.
-
L
Kaplan‐Meier curve comparing overall survival of vehicle and DEBIO‐0932‐treated mice following the schedule depicted in Fig
4A. (
n = 9 mice treated with vehicle and
n = 10 mice treated with DEBIO‐0932).
P value was calculated using log‐rank (Mantel‐Cox) test. The arrow indicates when the treatment was initiated.
-
M
Schema of experimental design. The brain metastatic melanoma cell line B16/F10‐BrM was intracranially injected to generate an established tumor so the treatment could start 3 days post‐injection.
-
N
Representative image of an established tumor 3 days post‐injection. The interface between the metastasis and the associated microenvironment is well‐defined. Scale bar: 50 µm (low magnification); 25 µm (high magnification).
-
O
Representative images of slices with the brain tumor at the end of the experiment. BB: Bisbenzamide. Scale bar: 1 mm.
-
P
Quantification of the tumor area at experimental endpoint. Values are shown in box‐and‐whisker plots where every dot represents a different brain and the line in the box corresponds to the median. The boxes go from the upper to the lower quartiles and the whiskers go from the minimum to the maximum value (n = 6 mice per experimental condition). P value was calculated using two‐tailed t‐test.
-
Q
Representative images of human brain metastases from which BrM‐PDOC were generated and evaluated as responders (Fig
4H) that showed no correlation with HSP90‐dependent oncogenic drivers ALK and ROS1. Scale bar: 50 µm.
-
R
Representative images of human brain metastases from which BrM‐PDOC were generated and evaluated as responders (Fig
4H) that showed positive correlation with HSP90‐dependent oncogenic drivers HER2 and BRAF. Scale bar: 50 µm. Targeting sequencing of the
EGFR locus of a lung cancer brain metastasis patient showing a deletion in exon 19 is also shown.
-
S
Pie chart showing the distribution of the ten BrM‐PDOCs with oncogenic drivers sensitive to HSP90 inhibition (Non‐HSP90 client: n = 4; EGFR mutant lung cancer: n = 2; HER2+ breast cancer: n = 3; BRAF mutant melanoma: n = 1).

