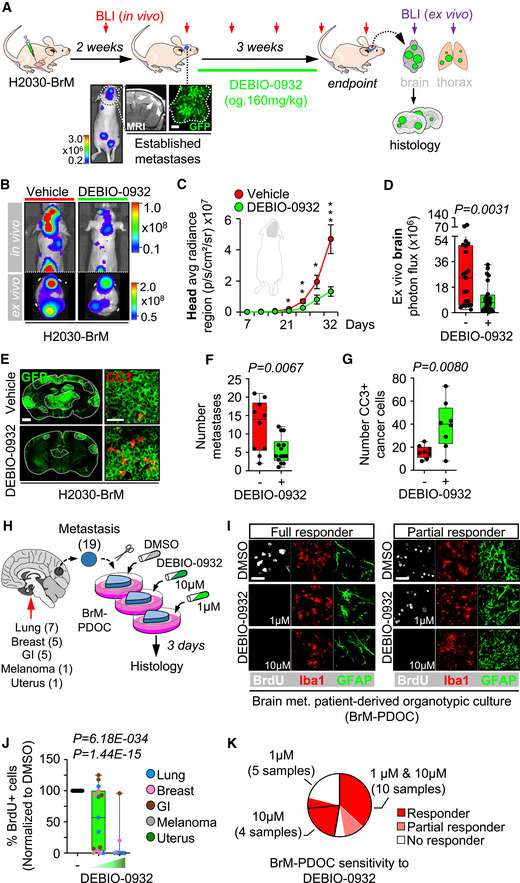
Schema of the experimental design. H2030‐BrM cells were inoculated intracardially into nude mice and established brain metastases were detected 2 weeks after by BLI, MRI (arrows) and histology (GFP+ cancer cells). DEBIO‐0932 was administered orally at 160 mg/kg for 3 weeks (daily during the first week and every 48 h during the two following weeks) and ex vivo BLI of brains and thoracic regions were analyzed. Brains were processed for histological analysis. Scale bar: 100 µm.
Representative in vivo and ex vivo images of vehicle and DEBIO‐0932‐treated mice 5 weeks (experimental endpoint) after intracardiac inoculation of H2030‐BrM cells.
Quantification of metastatic progression as measured by in vivo BLI of head of animals. Values are shown as mean ± s.e.m. (n = 23 vehicle and n = 25 DEBIO‐0932‐treated mice, 3 independent experiments). P value was calculated using two‐tailed t‐test (P values: *P < 0.05, **P < 0.01, ***P < 0.001).
Quantification of ex vivo BLI of brains at the endpoint of the experiment. Values are shown in box‐and‐whisker plots where every dot represents a different animal and the line in the box corresponds to the median. The boxes go from the upper to the lower quartiles and the whiskers go from the minimum to the maximum value (n = 21 vehicle and n = 24 DEBIO‐0932‐treated mice, three independent experiments). P value was calculated using two‐tailed t‐test.
Representative sections of brains from vehicle and DEBIO‐0932‐treated mice in (B–D). The dotted lines surround the metastases (GFP+). Representative field of view of metastasis stained with GFP and cleaved caspase 3. Scale bars: slices, 1 mm; cleaved caspase 3, 50 µm.
Quantification of established metastases found in vehicle and DEBIO‐0932‐treated brains from panel (E). Values are shown in box‐and‐whisker plots where every dot represents a different brain and the line in the box corresponds to the median. The boxes go from the upper to the lower quartiles and the whiskers go from the minimum to the maximum value (vehicle: n = 10 brains; DEBIO‐0932: n = 14 brains). P value was calculated using two‐tailed t‐test.
Quantification of number of cleaved caspase 3 (CC3+) in cancer cells found in vehicle and DEBIO‐0932‐treated brains from panel (E). Values are shown in box‐and‐whisker plots where every dot is a metastatic lesion and the line in the box corresponds to the median. The boxes go from the upper to the lower quartiles, and the whiskers go from the minimum to the maximum value (n = 8 metastatic lesions from 4 brains per condition). P value was calculated using two‐tailed t‐test.
Schema of the experimental design. Fresh surgically resected human brain metastases (n = 19) from various primary origins were used to perform patient‐derived organotypic cultures (BrM‐PDOC) and treated with DEBIO‐0932 at 10 µM and 1 µM for 3 days.
Representative BrM‐PDOC stained with proliferation markers (BrdU) and markers of the microenvironment (GFAP for astrocytes, Iba1 for microglia/ macrophages). Scale bar: 50 µm.
Quantification of the relative number of BrdU+ cancer cells found in DMSO DEBIO‐0932‐treated BrM‐PDOC respect to the corresponding PDOC treated with DMSO. Values are shown in box‐and‐whisker plots where every dot represents a patient (mean value obtained from all PDOC from the same condition and patient) and the line in the box corresponds to the median. The boxes go from the upper to the lower quartiles, and the whiskers go from the minimum to the maximum value (n = 19 patients with DMSO‐treated PDOC, n = 14 DEBIO‐0932 10 µM and n = 15 DEBIO‐0932 1 µM, each patient is an independent experiment). P value was calculated using two‐tailed t‐test. Dots are colored according to the primary source of the metastasis.
Pie chart showing all BrM‐PDOC in (J) classified according to the specific dose tested and the type of response observed. Partial responder means that the response was different depending on the dose of DEBIO‐0932, with PDOC not responding at 1 µM.

