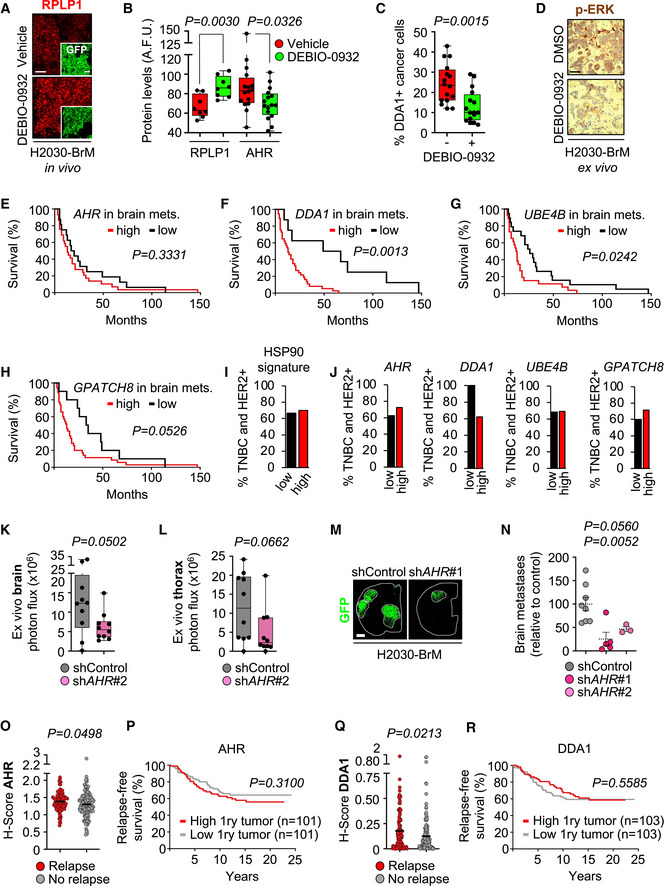
Figure EV4. In situ proteomics uncovers HSP90‐dependent brain metastasis mediators.

-
ARepresentative images showing RPLP1 levels in brain metastases (generated by intracardiac inoculation of H2030‐BrM) found at endpoint of vehicle and DEBIO‐0932‐treated animals. This result was reproduced in two independent staining with different brains. Scale bars: 50 µm.
-
BQuantification of RPLP1 and AHR levels shown in (Figs 6E and EV4A) in arbitrary fluorescent units (A.F.U.). Values are shown in box‐and‐whisker plots where each dot is a metastatic lesion and the line in the box corresponds to the median. The boxes go from the upper to the lower quartiles, and the whiskers go from the minimum to the maximum value (n = 8–16 metastatic lesions from 2 to 4 brains per condition, two independent staining with different brains were performed). P value was calculated using two‐tailed t‐test.
-
CQuantification of percentage of nuclear DDA1+ BB+ cells shown in (Fig 6E). Values are shown in box‐and‐whisker plots where each dot is a metastatic lesion, and the line in the box corresponds to the median. The boxes go from the upper to the lower quartiles, and the whiskers go from the minimum to the maximum value (n = 16 metastatic lesions from 4 brains per condition, 2 independent staining with different brains were performed). P value was calculated using two‐tailed t‐test.
-
DRepresentative images showing p‐ERK levels in organotypic cultures from (Fig 6A). This result was reproduced in three independent staining with organotypic cultures from different mice. Scale bar: 20 µm.
-
E–HKaplan‐Meier curves showing significant correlation between worse survival post‐brain metastasis and high gene expression levels of AHR (E), DDA1 (F), UBE4B (G), and GPATCH8 (H) in a cohort of 45 breast cancer brain metastasis patients.
-
I, JDistribution of poor prognosis breast cancer subtypes HER2+ and TNBC within the low and high gene expression level cohorts considering the signature (I) or individual genes (J).
-
K, LQuantification of ex vivo BLI of brains (K) and thoracic regions (L) of mice inoculated with H2030‐BrM cells carrying shControl or shAHR#2 at the endpoint of the experiment (5 weeks after injection of cancer cells). Values are shown in box‐and‐whisker plots where every dot represents a different animal and the line in the box corresponds to the median. The boxes go from the upper to the lower quartiles and the whiskers go from the minimum to the maximum value (n = 10 shControl mice and n = 10 shAHR#2 mice). P value was calculated using two‐tailed t‐test.
-
MRepresentative sections of brains from shControl and shAHR#1 mice 5 weeks (experimental endpoint) after intracardiac inoculation of cancer cells. The dotted lines surround the metastases (GFP+). Scale bar: 1 mm.
-
NQuantification of metastases found in brains inoculated with H2030‐BrM cells with shAHR. Relative metastatic load was normalized to the respective control. Values are shown in dot plots where every dot represents a different brain and the dotted line corresponds to the mean ± s.e.m. (n = 8 shControl; n = 5 shAHR#1; n = 3 shAHR#2 mice). P value was calculated using two‐tailed t‐test.
-
O, QH‐score analysis of AHR (O) and DDA1 (R) in primary tumors with (red) or without (gray) associated relapse. Values are shown in a scattered plot where each dot is a primary tumor and the line corresponds to the median (n = 100/103 primary tumors with relapse; n = 101/103 primary tumors without relapse, respectively). P value was calculated using two‐tailed t‐test.
-
P, RKaplan‐Meier curve comparing relapse‐free survival of primary tumors with high and low values of AHR (P) and DDA1 (R). P value was calculated using log‐rank (Mantel‐Cox) test.
