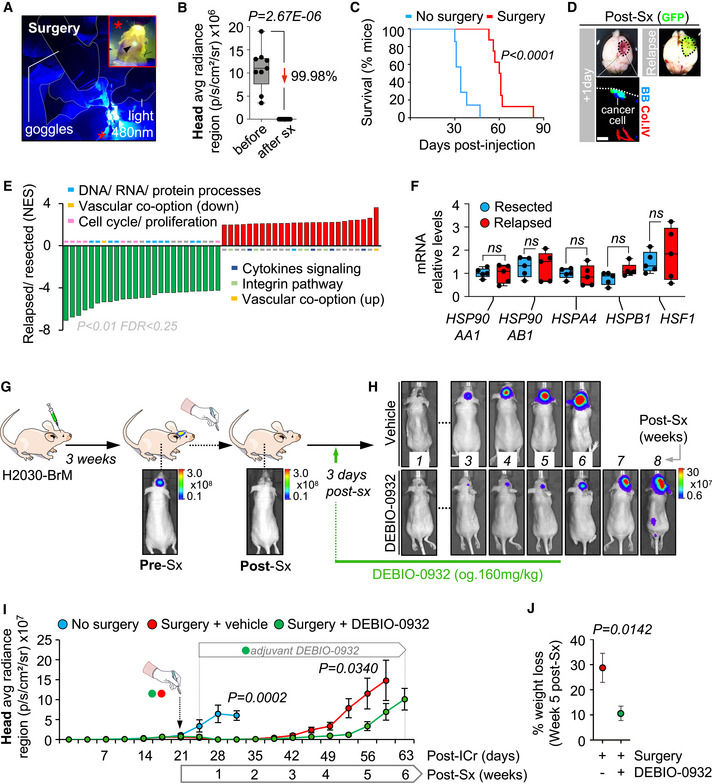
Detailed image of the neurosurgery procedure that visualizes the GFP+ brain tumor (high magnification) with a 480 nm light source and goggles equipped with emission filters. The asterisk in the low magnification labels the field of view for the surgeon, which is amplified in the high magnification through the emission filter equipped in the goggles. The arrow in the high magnification points to the GFP+ tumor as seen by the surgeon.
Quantification of BLI values before and one day after neurosurgery. Values are shown in box‐and‐whisker plots where every dot represents a different animal and the line in the box corresponds to the median. The boxes go from the upper to the lower quartiles, and the whiskers go from the minimum to the maximum value (n = 9 mice before and after surgery). P value was calculated using two‐tailed t‐test.
Kaplan‐Meier curve showing survival proportions of mice without (blue line, n = 7) and with surgery (red line, n = 8). P value was calculated using log‐rank (Mantel‐Cox) test.
Representative images of brains one day after neurosurgery and at the endpoint of local relapse. Remaining cancer cells (GFP+) were found under the microscope in the surgical bed. GFP fluorescence of fully relapsed tumor at the experimental endpoint could be observed macroscopically. BB: bisbenzamide. Col.IV: collagen IV. Scale bar: 25 µm.
GSEA of top 25 up‐ (red) and downregulated (green) signatures comparing matched relapsed and resected brain metastases from animals receiving neurosurgery.
qRT–PCR of H2030‐BrM brain metastases obtained from animals during neurosurgery compared to relapsed metastases from the corresponding animals. A panel of five genes related to HSP90 pathway is evaluated. Values are shown in box‐and‐whisker plots where every dot represents a different animal and the line in the box corresponds to the median. The boxes go from the upper to the lower quartiles, and the whiskers go from the minimum to the maximum value (n = 5 mice per experimental condition). P value was calculated using two‐tailed t‐test.
Schema of experimental design. H2030‐BrM cells were implanted intracranially into nude mice and established brain metastases were surgically resected. DEBIO‐0932 was administered orally at 160 mg/kg 3 days later and during 5–6 weeks following an individualized regimen. Sx: surgery.
Representative images of vehicle and DEBIO‐0932‐treated mice after neurosurgery until experimental endpoint at 6 and 8 weeks for vehicle and DEBIO‐0932‐treated mice, respectively.
Quantification of brain tumor progression as measured by in vivo BLI of head region in animals without surgery, with surgery and vehicle or DEBIO‐0932. DEBIO‐0932 treatment was initiated 3 days after surgery, which was applied 3 weeks post‐injection of BrM cells, and maintained for 5–6 weeks after local treatment. Values are shown as mean ± s.e.m. (n = 7 without surgery, n = 8 surgery + vehicle and n = 11 surgery + DEBIO‐0932‐treated mice, 2 independent experiments). P value was calculated using two‐tailed t‐test (No surgery versus surgery + vehicle (day 32), P = 0.0002; surgery + vehicle versus surgery + DEBIO‐0932 (day 56), P = 0.0340).
Quantification of the percentage of weight loss at advanced stages of local relapse (week 5 post‐surgery). Values were obtained relative to the mean weight for each group at day 19, which corresponds to the highest weight value before any decrease could be detected. Values are shown as mean ± s.e.m. (n = 4 surgery + vehicle and n = 6 surgery + DEBIO‐0932‐treated mice, 1 experiment). P value was calculated using two‐tailed t‐test.

