-
A
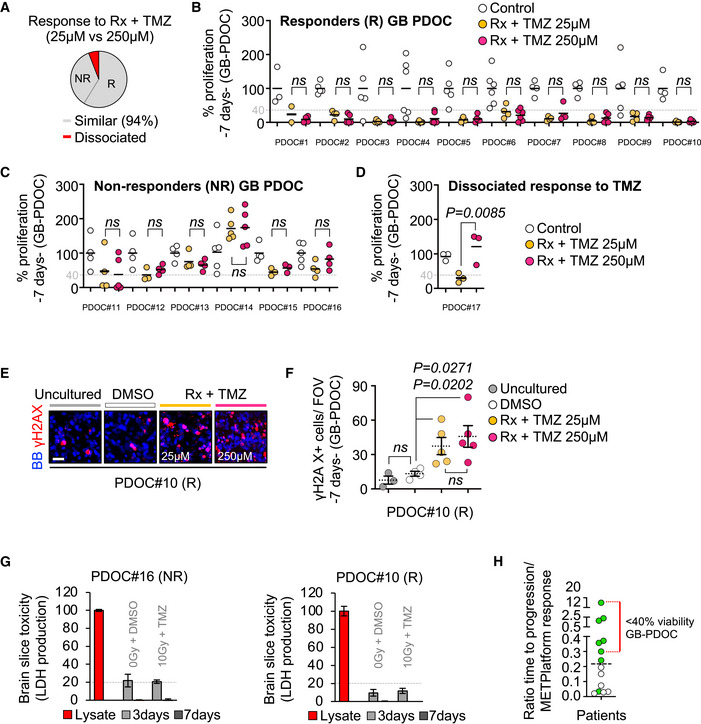
Pie chart categorizing the 17 GB‐PDOC treated with radiation (Rx) and temozolomide (TMZ) into responders (R) and non‐responders (NR) independently of the dose of TMZ given (gray). Red area is labeling the single PDOC with a non‐homogeneous response to the two different doses of TMZ (D).
-
B–D
Quantification of the impact of Rx + TMZ on the proliferation of cancer cells from GB‐PDOC. Values are normalized to the respective control without treatment. Each dot represents an organotypic culture from each GB‐PDOC. GB‐PDOC was classified as responder when the mean (line in each dot cluster) is below 40%. P value was calculated using two‐tailed t‐test.
-
E
Representative images of a responder GB‐PDOC stained with a DNA‐damage marker, γ‐H2AX (red). BB: bisbenzamide. Scale bar: 25 µm.
-
F
Quantification of the number of γ‐H2AX+ cancer cells in the GB‐PDOC shown in (E). Each dot represents and individual organotypic culture where the mean number of cells positive for the DNA‐damage marker was measured. The dotted line represents the mean ± s.e.m. (n = 3, uncultured organotypic slices from the tumor; n = 4 GB‐PDOC treated with DMSO (1%); n = 5 GB‐PDOC treated with Rx + TMZ (25 μM); n = 5 GB‐PDOC treated with Rx + TMZ (250 μM)). P value was calculated using two‐tailed t‐test.
-
G
Quantification of LDH levels in the conditioned media of organotypic slices cultured during 3 and 7 days relative to a lysate of the same GB‐PDOC. Values are shown as mean + s.e.m. (n = 3 organotypic cultures per experimental condition, each graph correspond to an individual GB‐PDOC). LDH levels at 7 days measure the accumulation of the enzyme in the media from day 3 on.
-
H
Post hoc quantification of the ratio between the number of months with stable disease in each patient (at cut off September 2021) and the corresponding % of proliferation after GB‐PDOC treatment in METPlatform. The dotted line indicates the median. Each dot corresponds to a patient. Green dots: patient with stable disease; white dots: patients with progressive disease. The red line labels those patients with a reduction above 40% in cancer cell proliferation in the corresponding GB‐PDOC.

