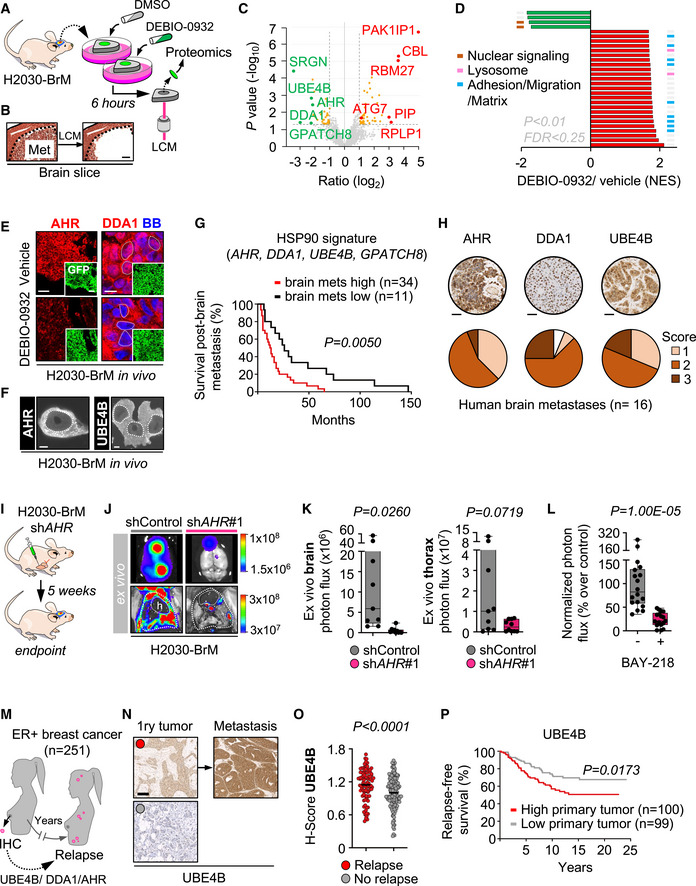
Schema of experimental design. Organotypic cultures with established brain metastases from H2030‐BrM cells were treated with DEBIO‐0932 at 1 µM for 6 h and subjected to laser capture microdissection (LCM) and proteomic profiling.
Representative image of a fully established brain metastasis from H2030‐BrM before and after laser capture microdissection (LCM). The dotted line delimits the metastasis. Scale bar: 100 µm.
Volcano plot with deregulated proteins (red: upregulated; green: downregulated) found in brain metastases treated with DEBIO‐0932 compared to DMSO (n = 3 biological replicates (mice) per condition, n ≥ 12 brain metastases per mouse were pooled together). Proteins with a P < 0.05 and a log2 ratio > 1 or < −1 were defined as deregulated. Gray dotted lines indicate P value and log2 ratio cut offs. The names of the top deregulated proteins are shown.
GSEA of top 25 upregulated (red) and downregulated (green; only four fulfill the filter) pathways upon DEBIO‐0932 treatment. Those biological processes represented with more than one signature are labeled with colored lines.
Representative images showing AHR and DDA1 levels in brain metastases (generated by intracardiac inoculation of H2030‐BrM) found at endpoint of vehicle and DEBIO‐0932‐treated animals. This result was reproduced in 2 independent staining with different brains. BB: bisbenzamide. Scale bars: low magnification (HSP90 and GFP), 50 µm; high magnification (DDA1), 6 µm (dotted lines).
Representative images of squash preparations showing nuclear AHR and UBE4B in established brain metastases from H2030‐BrM generated by intracardiac inoculation. Scale bar: 5 µm. The dashed line surrounds the nucleus.
Kaplan–Meier curves showing significant correlation between worse survival post‐brain metastasis and high expression levels of the HSP90 signature (AHR, DDA1, UBE4B, GPATCH8) in a cohort of 45 breast cancer brain metastasis patients.
Representative images (selected cases obtained from Fig EV6M) and histological score of AHR, DDA1 and UBE4B in human brain metastases (n = 16) according to the signal intensity of the corresponding protein in cancer cells.
Schema of the experimental design. H2030‐BrM cells carrying the corresponding shRNA against AHR or the non‐targeting control were inoculated intracardially into nude mice. Ex vivo BLI of brains and thoracic regions were analyzed 5 weeks after injection of cancer cells. Brains were processed for histological analysis.
Representative images of brains and thorax from shControl and shAHR#1 mice at the endpoint of the experiment.
Quantification of ex vivo BLI of brains and thoracic regions at the endpoint of the experiment. Values are shown in box‐and‐whisker plots where every dot represents a different animal and the line in the box corresponds to the median. The boxes go from the upper to the lower quartiles, and the whiskers go from the minimum to the maximum value (n = 9 shControl mice and n = 10 shAHR#1 mice). P value was calculated using two‐tailed t‐test.
Quantification of the bioluminescence signal emitted by H2030‐BrM established metastases in organotypic cultures at Day 7 normalized by the initial value obtained at Day 0 and normalized to the organotypic cultures treated with DMSO. Day 0 is considered right before addition of the treatment or DMSO. Values are shown in box‐and‐whisker plots where each dot is an organotypic culture and the line in the box corresponds to the median. The boxes go from the upper to the lower quartiles and the whiskers go from the minimum to the maximum value (n = 17 organotypic cultures treated with DMSO; n = 18 organotypic cultures treated with BAY‐218, 2 independent experiments). P value was calculated using two‐tailed t‐test.
Schema depicting the evaluation of a clinical cohort composed of 251 ER+ breast cancer primary tumors with follow‐up to determine the correlation of UBE4B, DDA1 or AHR with relapse.
Representative images of primary tumors with high (red dot) or low (gray dot) UBE4B levels. A few cases of matched primary metastases allowed to evaluate the HSP90‐dependent protein. Scale bar: 100 µm.
H‐score analysis of UBE4B in primary tumors with (red) or without (gray) associated relapse. Values are shown in a scattered plot where each dot is a primary tumor and the line corresponds to the median (n = 100 primary tumors with relapse; n = 147 primary tumors without relapse). P value was calculated using two‐tailed t‐test.
Kaplan–Meier curve comparing relapse‐free survival of primary tumors with high and low values of UBE4B. P value was calculated using log‐rank (Mantel‐Cox) test.

