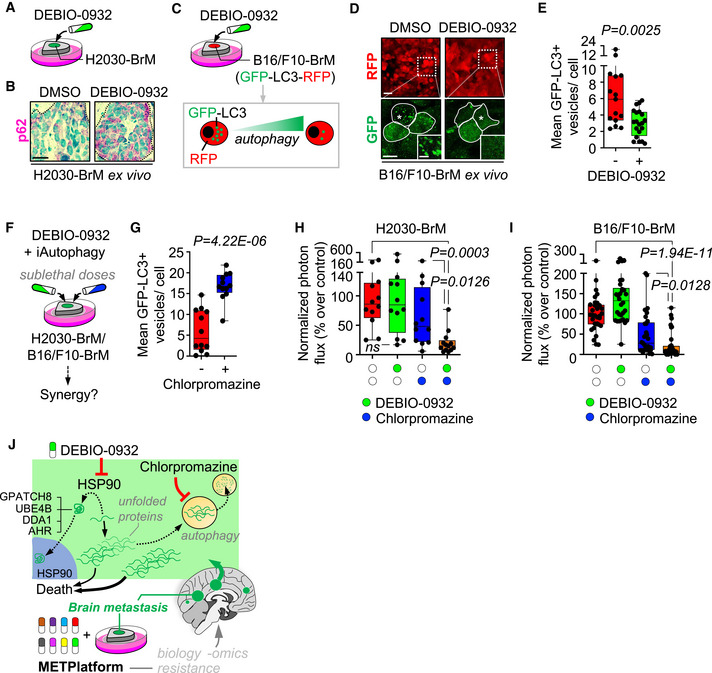
Schema of experimental design. Organotypic cultures with established brain metastases from H2030‐BrM cells were treated with DEBIO‐0932 and evaluated for p62 levels.
Representative images showing p62 levels. This result was reproduced in three independent staining with organotypic cultures from different mice. Dotted lines delimit the metastasis. Scale bar: 10 µm.
Schema of experimental design. Organotypic cultures with brain metastases from B16/F10‐BrM‐GFP‐LC3‐RFP cells were treated with DEBIO‐0932 and monitored for autophagic flux by GFP‐LC3+ puncta (vesicles).
Representative organotypic cultures from the experiment in panel (C). RFP is an internal control probe labeling cancer cells independent of autophagy flux and GFP indicate GFP‐LC3+ puncta. The dotted line in the upper panel delimits a high magnification area shown in the lower panel respect to the GFP signal derived from GFP‐LC3 accumulation. Dotted lines in lower panel surround individual cancer cells. Asterisk labels the area in the cell magnified in the high magnification panel showing the GFP‐LC3+ puncta. Scale bar: low magnification, 25 µm; high magnification (cells), 10 µm; high magnification (puncta), 2.5 µm.
Quantification of GFP‐LC3+ vesicles per cell of the experiment in panel (C). Values are shown in box‐and‐whisker plots where every dot represents a field of view of an organotypic culture and the line in the box corresponds to the median. The boxes go from the upper to the lower quartiles, and the whiskers go from the minimum to the maximum value (DMSO: n = 15 fields of view, 2,232 cancer cells from 3 organotypic cultures; DEBIO‐0932: n = 20 fields of view, 3,260 cancer cells from 4 organotypic cultures). P value was calculated using two‐tailed t‐test.
Schema of experimental design. Organotypic cultures with established brain metastases were treated with DEBIO‐0932 and autophagy inhibitors at sublethal doses.
Quantification of GFP‐LC3+ vesicles per cell in organotypic cultures with brain metastases from B16/F10‐BrM‐GFP‐LC3‐RFP cells treated with chlorpromazine (20 µM) and monitored for autophagic flux by GFP‐LC3+ puncta (vesicles). Values are shown in box‐and‐whisker plots where every dot represents a field of view of an organotypic culture and the line in the box corresponds to the median. The boxes go from the upper to the lower quartiles and the whiskers go from the minimum to the maximum value (DMSO: n = 12 fields of view, 1,919 cancer cells from 3 organotypic cultures; chlorpromazine: n = 12 fields of view, 1,759 cancer cells from 3 organotypic cultures). P value was calculated using two‐tailed t‐test.
Quantification of the bioluminescence signal emitted by H2030‐BrM cells in each organotypic culture with established brain metastases at Day 3 normalized by the initial value at Day 0 (before the addition of any treatment; DEBIO‐0932 was added at 100 nM and chlorpromazine at 20 µM) and normalized to the organotypic cultures treated with DMSO. Values are shown in box‐and‐whisker plots where every dot represents an organotypic culture and the line in the box corresponds to the median. The boxes go from the upper to the lower quartiles and the whiskers go from the minimum to the maximum value (n = 12–13 organotypic cultures per experimental condition, 3 independent experiments). P value was calculated using two‐tailed t‐test.
Quantification of the bioluminescence signal emitted by B16/F10‐BrM cells in each condition (DEBIO‐0932 was added at 100 nM and chlorpromazine at 15 µM) at Day 3 normalized by the initial value obtained at Day 0 and normalized to the organotypic cultures treated with DMSO. Day 0 is considered 12–16 h after the addition of B16/F10‐BrM cancer cells and treatment or DMSO. Values are shown in box‐and‐whisker plots where each dot is an organotypic culture and the line in the box corresponds to the median. The boxes go from the upper to the lower quartiles, and the whiskers go from the minimum to the maximum value (n = 30–33 organotypic cultures per experimental condition, 4 independent experiments). P value was calculated using two‐tailed t‐test.
Graphical summary. METPlatform is a valuable tool for metastasis research that integrates drug‐screening and omic approaches to study pharmacological and biological vulnerabilities. We demonstrate that one vulnerability corresponds to the dependency on HSP90. The BBB‐permeable HSP90 inhibitor DEBIO‐0932 is an effective therapeutic strategy against established brain metastasis and the analysis of such phenotype with in situ proteomics revealed potential novel mediators of brain metastasis downstream HSP90. At the same time, autophagy appears as an actionable mechanism of resistance upon HSP90 inhibition, allowing design of rationale combinations using autophagy inhibitors and DEBIO‐0932 to target brain metastasis more effectively if appropriate drugs could be combined in vivo.

