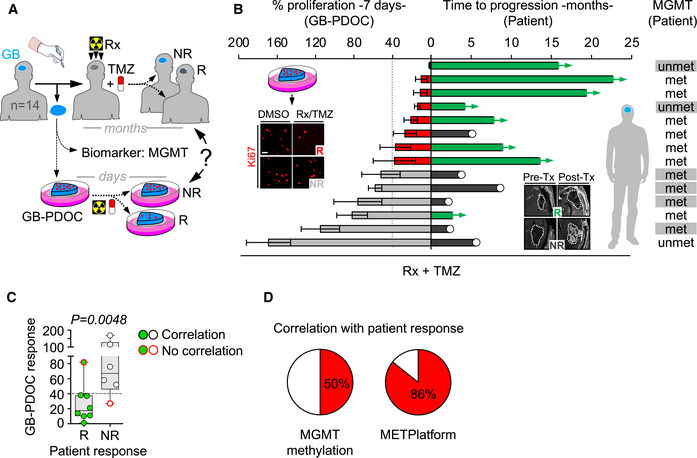
Figure 8. METPlatform as a clinically compatible “avatar”.

- Schema of experimental design using GB‐PDOC.
- Correlation between response in GB‐PDOC (left side of the graph) and its respective patient (right side of the graph). Response in GB‐PDOCs was obtained by quantification of number of proliferative cancer cells found in Rx + TMZ treated normalized to DMSO‐treated (100%) PDOCs from the same patient. Representative GB‐PDOC responding (R) or not (NR) to the standard of care that was provided ex vivo (Radiation (Rx): 2 × 10 Gy + temozolomide (TMZ) 250 µM) are shown. Scale bar: 50 µm. Values are shown as mean ± s.e.m. (n = 3–6 PDOCs per experimental condition per patient, each patient is represented in an individual bar. Fourteen patients included; each patient is an independent experiment). Time to progression of the patients after neurosurgery is represented in months. Response to Rx + TMZ was evaluated by volumetric measurement of the lesion (dashed line) based on MRI before and after the treatment. Representative patients responding (R) or not (NR) to the standard of care are shown. A white circle indicates progressive disease. Patients with ongoing response to Rx + TMZ (stable disease) are indicated with green bars. MGMT promoter methylation status is shown for each patient (met: methylated; unmet: unmethylated). N/A: not available.
- Correlation between GB‐PDOC and patient responses. GB‐PDOC response is indicated by the mean value in percentage of proliferation post‐treatment, where 40% represents the threshold. Patients are classified as responder (R) (green dots, 8 patients) or non‐responder (NR) (white dots, 6 patients) according to the MRI evaluation. Values are shown in box‐and‐whisker plots where each dot is a patient and the corresponding GB‐PDOC and the line in the box corresponds to the median. The boxes go from the upper to the lower quartiles and the whiskers go from the minimum to the maximum value. P value was calculated using two‐tailed t‐test.
- Pie charts representing the percentage of patients where MGMT methylation status correlates with the expected therapeutic response in the patient and the same respect to the response of the GB‐PCOC in METPlatform.
