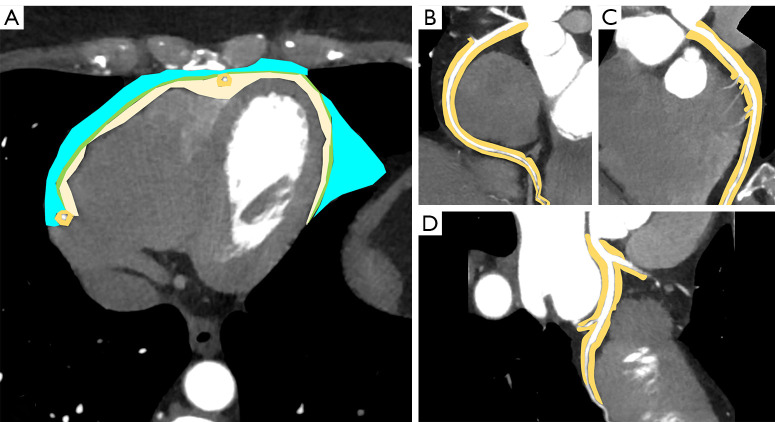
Figure 3.
Coronary CT on axial plane (A) shows regions of interest (ROIs) of PCAT (light orange ROI), EAT (light yellow ROI), pericardial adipose tissue (green ROI) and paracardial adipose tissue (light blue ROI). Curved plane reconstructions of right coronary artery (B), left anterior descending artery (C) and circumflex artery (D), with highlighted perivascular adipose tissue (light orange ROI). CT, computed tomography; PCAT, pericoronary adipose tissue; EAT, epicardial adipose tissue.

