
Figure 2.
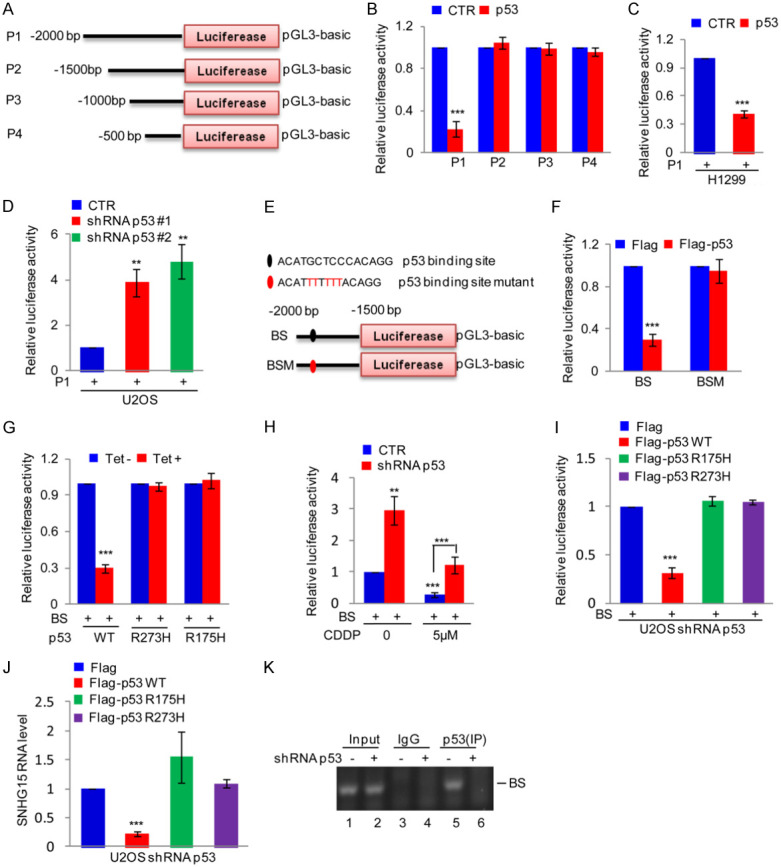
p53 binds the SNHG15 promoter. (A) Schematic illustration of the pGL3-based reporter constructs used to evaluate SNHG15 promoter activity. (B) The SNHG15 promoter constructs P1, P2, P3 and P4 were separately transfected into 293T cells with or without p53, and then the promoter activity was detected. Data are presented as the means ± SD of triplicate measurements, ***P<0.001. (C) P1 was transfected into H1299 cells with or without p53 overexpression. The luciferase activity was measured. Data are presented as the means ± SD of triplicate measurements, ***P<0.001. (D) P1 was transfected into p53 knockdown U2OS cells, and then SNHG15 promoter activity was measured. Data are presented as the means ± SD of triplicate measurements, **P<0.01. (E) Schematic illustration of the wild-type p53 binding site (BS) and the matching mutant site (BSM) in the SNHG15 promoter. (F) BS or BSM was transfected with or without p53 into HEK293T cells, and then the promoter activity of BS and BSM was measured. Data are presented as the means ± SD of triplicate measurements, ***P<0.001. (G) BS was introduced into H1299 cells along with p53 or p53 mutants, and then the promoter activity was detected. Data are presented as the means ± SD of triplicate measurements, ***P<0.001. (H) BS was introduced into p53 knockdown U2OS cells or control cells. Cells were then treated with or without 5 μM CDDP for 24 h before assaying for luciferase activity. Data are presented as the means ± SD of triplicate measurements, **P<0.01 and ***P<0.001. (I, J) The wild type p53 and mutants were introduced into p53 silenced U2OS cells together with BS. The activity of BS and SNHG15 expression were measured (I, J). Data are presented as the means ± SD of triplicate measurements, ***P<0.001. (K) ChIP analysis showing the binding of p53 to the SNHG15 promoter in p53 knockdown U2OS cells or control cells.