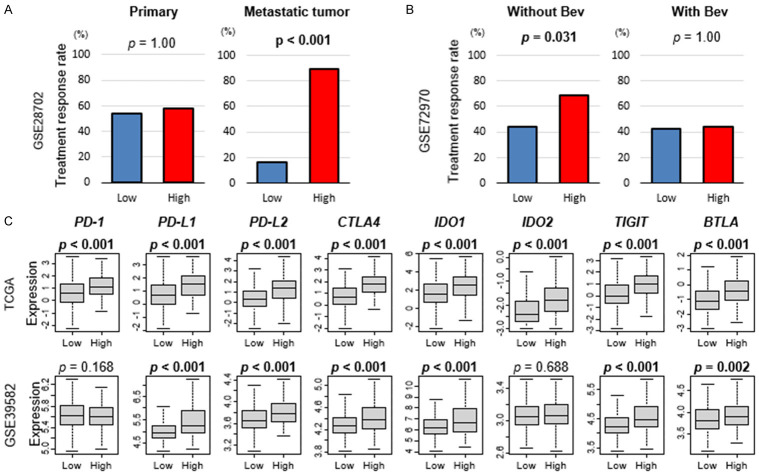
Figure 6.
Association of Tregs with drug response in CRC. A. Bar plots of response rate to mFOLFOXC6 by low and high Tregs groups in primary and metastatic CRC in the GSE28702 cohort. B. Bar plots of response rate to chemotherapy with/without bevacizumab (Bev) by low and high Tregs groups in the GSE72970 cohort. C. Boxplots comparing low and high Tregs group with expression levels of immune checkpoint molecules (programmed death-1; PD-1, programmed death ligand 1; PD-L1, programmed death ligand 2; PD-L2, cytotoxic T-lymphocyte-associated protein 4; CTLA4, indoleamine dioxygenase 1; IDO1, T cell immunoreceptor with Ig and ITIM domains; TIGIT, B- and T-lymphocyte attenuator; BTLA) in CRC in the TCGA and GSE39582 cohorts. Mann-Whitney U test was used to perform the analysis.

