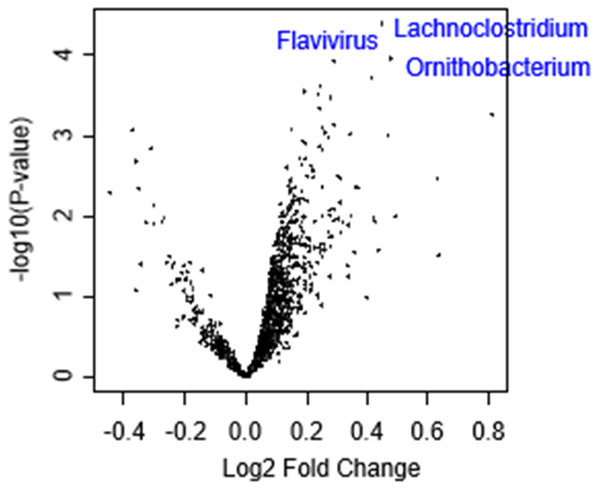
Figure 7.

Association of Tregs with microbiome in CRC. Volcano plot showing the differentially expressed mRNAs of gut microbiomes between low and high Tregs CRC groups. X-axes: log2 fold change (FC), Y-axes: -log10 P-value from limma analysis. Mann-Whitney U test was used to perform the analysis.
