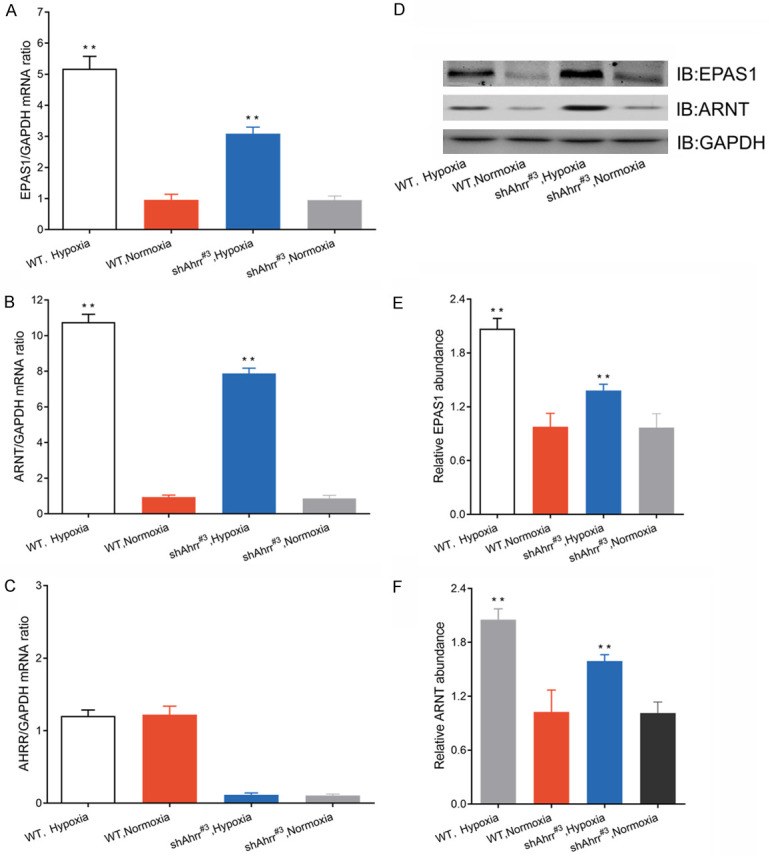
Figure 4.

Interaction of EPAS1, ARNT, and AHRR in HNC cells of AHRR-null or wild-type. A-C. Quantitative RT-PCR analysis of EPAS1, ARNT, and AHRR mRNAs in HNC cells 2 days after hypoxia. The data were standardized by the abundance of GAPDH mRNA. D-F. Western blotting analysis (IB) of EPAS1, ARNT and GAPDH in nuclear extracts of isolated HNC cells after 3 days of hypoxia. All quantitative data were mean ± SEM of HNC cells in each group. **P<0.05 versus HNCs and HNCs/shNT.
