Figure 3.

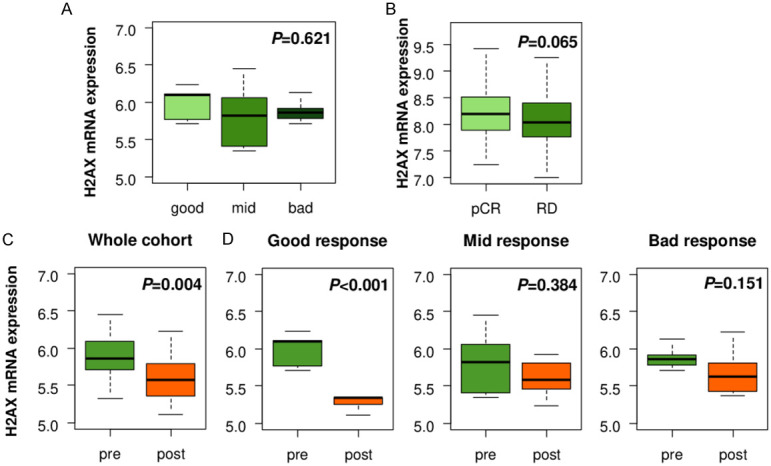
Association between H2AX levels and chemotherapy in breast cancer. (A) H2AX expression assessment in pre-chemotherapy tumors by treatment response in GSE28844 breast cancer cohort. Good response: n=5, mid response: n=10, bad response: n=13. (B) H2AX expression comparison between pathological complete response (pCR) and residual disease (RD) groups in GSE25066 breast cancer cohort. pCR: n=99, RD: n=389. H2AX expression comparison between pre- and post-chemotherapy tumors in (C) whole cohort (n=28), (D) good (n=5), mid (n=10), and bad (n=13) response group in GSE28844 breast cancer cohort.
