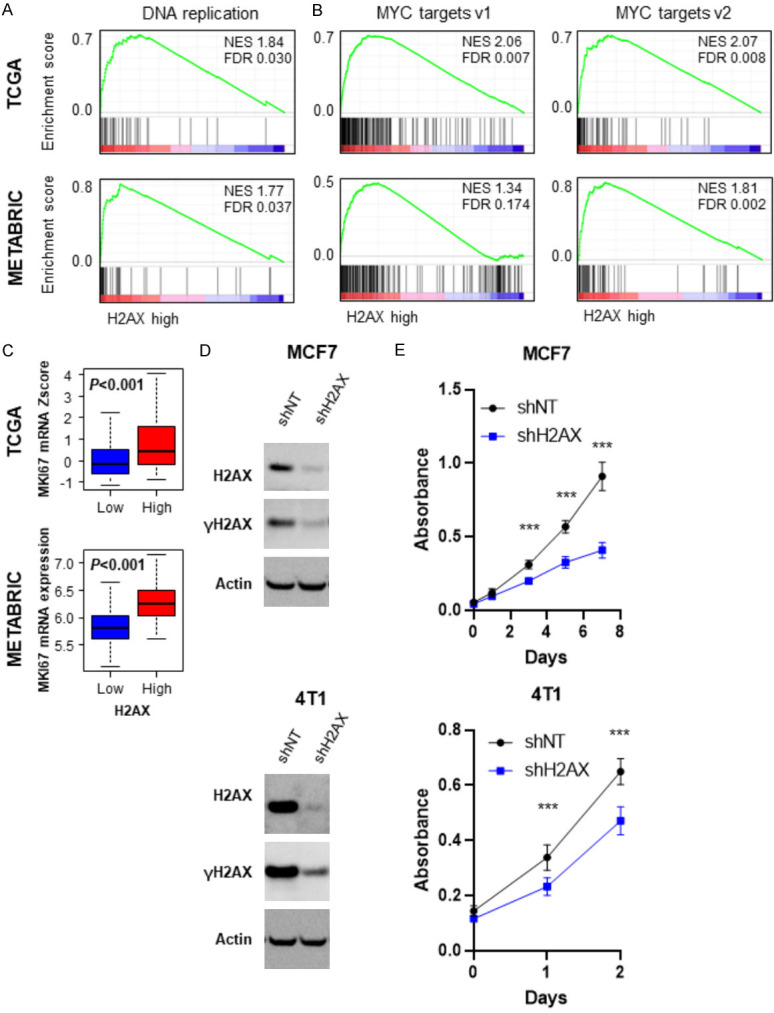
Figure 5.

H2AX dependent proliferation rate in breast cancer. A. Gene set enrichment analysis (GSEA) of DNA replication pathway in comparison to high and low H2AX breast cancer in TCGA (upper) and METABRIC (lower) cohort. B. GSEA of MYC target genes in H2AX high and low breast cancers in TCGA (upper) and METABRIC (lower) cohort. C. MKI67 expression levels H2AX low and high breast cancer in TCGA (upper) and METABRIC (lower). H2AX high: n=55, H2AX low: n=1034 for TCGA, H2AX high: n=72, H2AX low: n=1351 for METABRIC. D. Immunoblot analysis of H2AX knockdown MCF7 and 4T1 cells. E. Cell proliferation rate of control and H2AX knockdown MCF7 and 4T1 cells (n=6, each). ***P<0.001.
