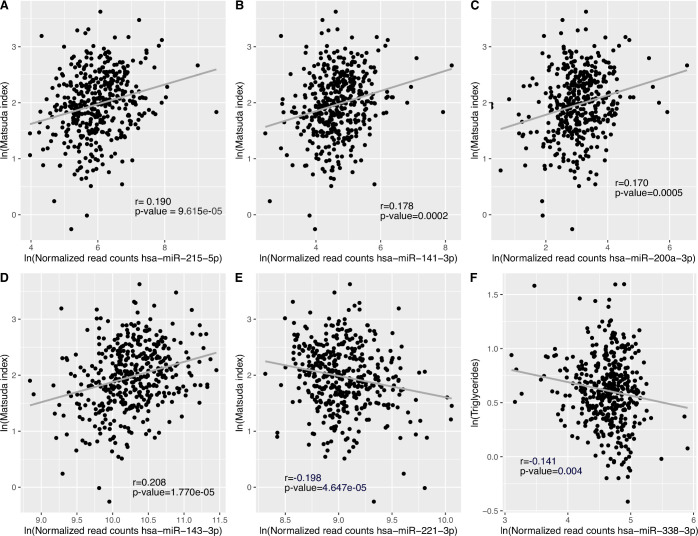
Figure 2.
Pearson partial correlations between miRNAs, Matsuda Index and triglyceride levels. (A)-(E) DESeq2 normalized reads counts for top five miRNAs associated with IS, and Matsuda Index values were ln-transformed to normalize the distribution of data. The models were adjusted for gestational age, as well as maternal age and BMI at first trimester of pregnancy. Results were considered statistically significant at Bonferroni-adjusted p-value ≤0.01 (0.05 (p-value threshold)/5 tests). (F) DESeq2 normalized read counts and triglyceride levels were ln-transformed to normalize the distribution of data. The model was adjusted for gestational age, as well as maternal age and BMI at first trimester of pregnancy. Results were considered statistically significant at Bonferroni-adjusted p-value ≤0.0042 (0.05 (p-value threshold)/12 tests: four miRNAs and three lipids). BMI, body mass index; IS, insulin sensitivity; miRNAs, microRNAs.

