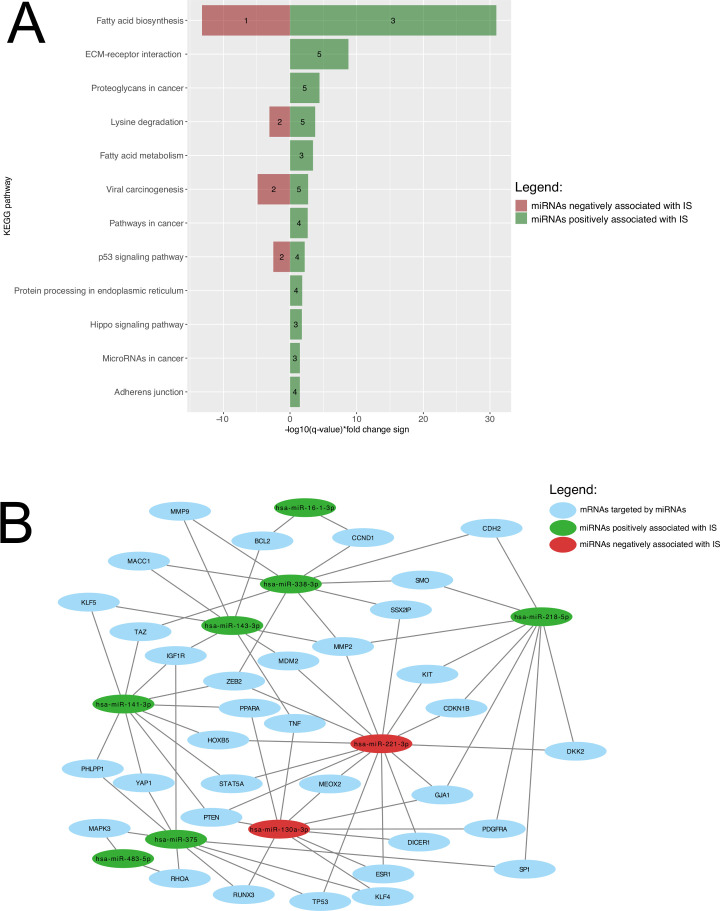
Figure 3.
Biological pathway’s enrichment analysis and miRNA-mRNA interaction analysis of miRNAs predicting IS. (A) KEGG pathways are presented according to their respective FDR-adjusted p-value. Green bars represent miRNAs positively associated with IS, whereas pathways negatively associated miRNAs are shown as red bars. The number of miRNAs regulating the identified pathway are shown within the green and red bars. (B) Interactome showing relation between miRNAs predicting IS and their mRNA targets. For a better visualization, only interactions between miRNAs and mRNAs targeted by two or more miRNAs (35 mRNAs and seven miRNAs) were included. Green and red circles, respectively, represent miRNAs positively and negatively associated with IS. Blue circles represented mRNAs targeted by those miRNAs. ECM, extracellular matrix; FDR, false discovery rate; IS, insulin sensitivity; KEGG, Kyoto Encyclopedia of Genes and Genomes; mRNA, messenger RNA; miRNA, microRNA.

