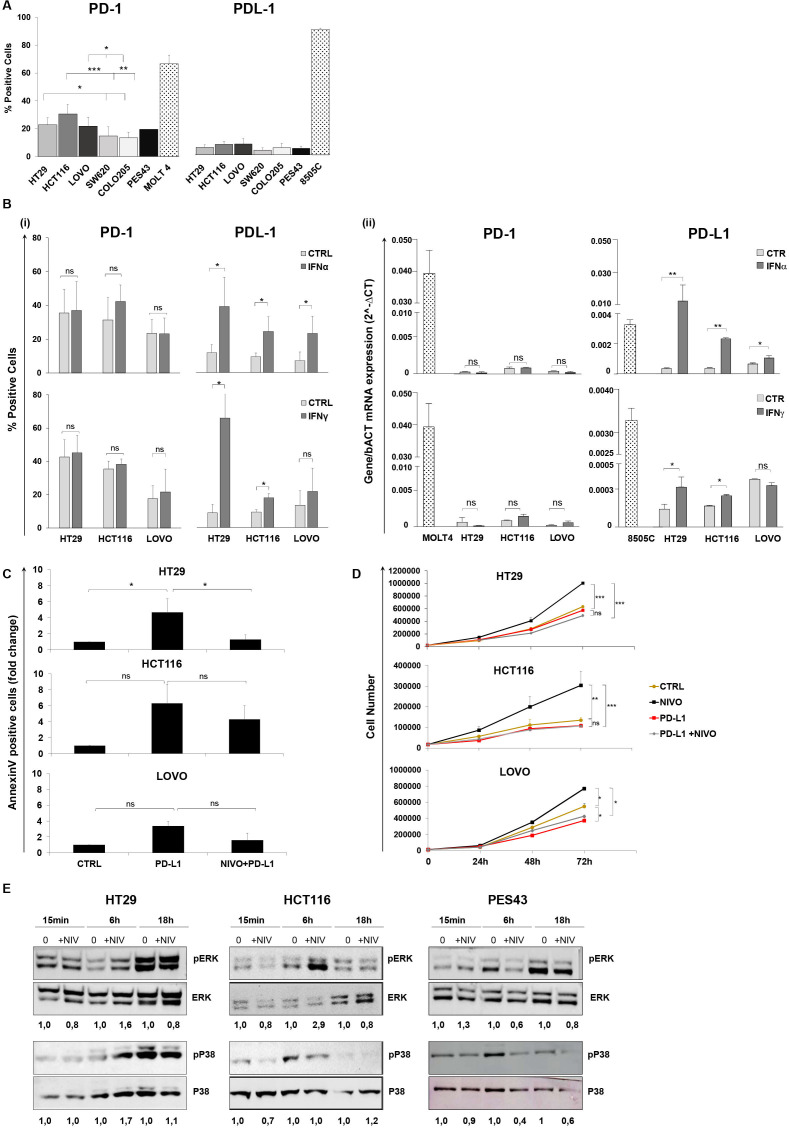
Figure 1.
Human colon cancer cells express functional PD-1 that is not regulated by IFN-α/γ. PD-1 blockade increases human colon cancer cell growth. (A) Percentages (mean±SD) of PD-1 and PD-L1 surface protein expression on five colon cancer cells (HT29, HCT116, LoVo, SW620, Colo205), as determined by flow cytometry. Bar charts show combined results from at least three independent experiments. PES43 (human melanoma cancer cell line) and MOLT4 (human T-cell acute lymphocytic leukemia cell line) were used as PD-1 positive control and 8505C (human anaplastic thyroid cancer cell line) was used as PD-L1 positive control. *P value <0.05; **p value <0.01; ***p value <0.001. Student’s t-test was used. (B) Histograms represent changes in (i) % fluorescence intensity by flow cytometry (mean±SD) and (ii) mRNA expression indicated as 2∆Ct for PD-1 and PD-L1 in HT29, HCT116, and LoVo cells treated with IFN-γ (50 IU/mL) for 48 hours and IFN-α (3000 IU/mL) for 24 hours. Bar graphs represent the average of at least three experiments. P value >0.05 ns (not significant); *p value <0.05. Student’s t-test was used. (C) HT29, HCT116, and LoVo cells were treated with sPD-L1 (1 µg/mL) or sPD-L1 +NIVO (10 µM) for 24 hours. Cell apoptosis rates were detected through Annexin V and propidium iodide (PI) dual staining method. Relative fold change of apoptotic cells is shown in the histogram (mean±SD). Bar graphs represent the average of two experiments. P value >0.05 ns; *p value <0.05. Student’s t-test was used. (D) HT29, HCT116, and LoVo growth curves following NIVO (10 µM), sPD-L1 (1 µg/mL), or combination sPD-L1 +NIVO treatment for 24, 48, and 72 hours. All data are representative of at least two experiments. P value >0.05 ns; *p value <0.05; **p value<0.01; ***p value <0.001. Student’s t-test was used. (E) Immunoblot analysis (representative of n=2 independent experiments) of phosphorylated (p) and total ERK1/2 and P38 in HT29, HCT116, and PES43 cell lines treated with NIVO (10 µM) for 15 min, 6–18 hours. The numbers above the gel lanes represent the relative protein level, which was determined from the band intensity using ImageJ software, and normalized relative to the total protein. IFN, interferon; NIVO, nivolumab; sPD-L1, soluble PD-L1.

