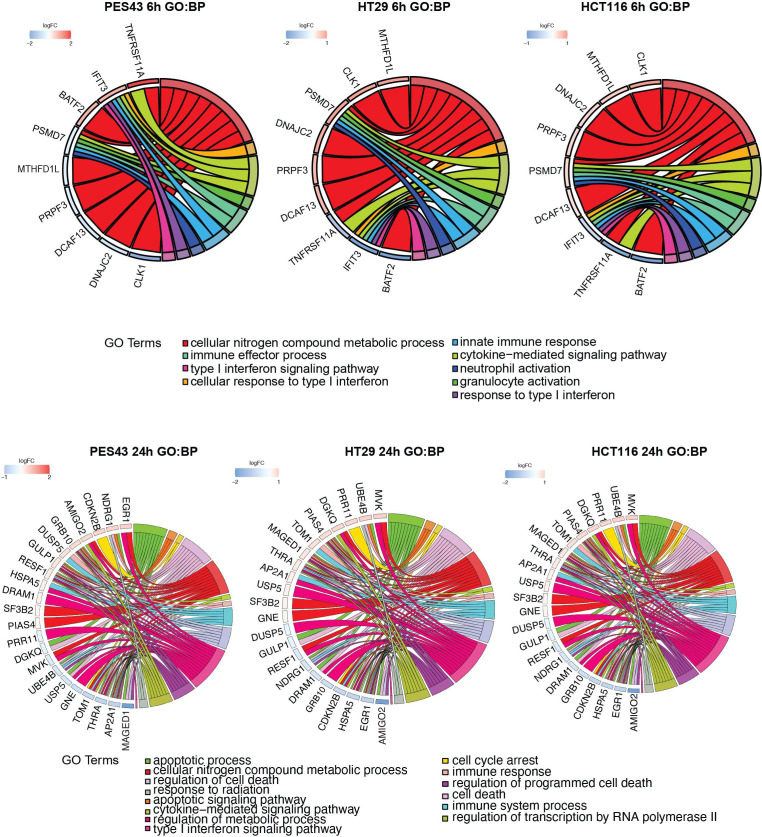
Figure 4.
GO functional enrichment analysis of differentially expressed genes (DEGs) in NIVO-treated human colon cancer and melanoma cells. GO Chord plot of selected common genes differentially expressed in the PES43, HCT116, and HT29 cells treated with NIVO for 6 hours (upper panel) or for 24 hours (lower panel). The genes are linked to their assigned pathway via colored ribbons. Genes are ordered according to the observed log2 fold change (LogFC), which is displayed in descending intensity next to the selected genes from red (higher expression during NIVO treatment) to blue (lower expression during NIVO treatment). NIVO, nivolumab.

