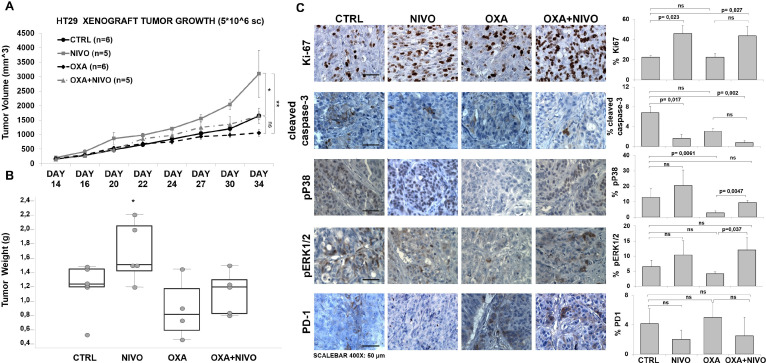
Figure 5.
PD-1 blockade accelerated the growth of subcutaneous HT29 tumors and decreased efficacy of chemotherapy. Tumor growth curve (caliper tumor volumes±SEM) (A) and tumor weight (grams) (B) of HT29 tumor subcutaneously implanted in CD1 athymic mice treated as indicated. (C) Immunohistochemistry (IHC) for Ki67, cleaved caspase-3, pP38, pERK1/2, PD-1. Representative microphotographs (left) show localization of selected markers. The scale bars at the bottom of the figure indicate 50 µm for ×400 magnification. P value <0.05 was considered statistically significant for Kruskal-Wallis test followed by Dunn’s multiple comparison. Bar graph (right) illustrates quantification of immunohistochemistry staining from collected tumors (means±SD). NIVO, nivolumab; OXA, oxaliplatin; PD-1, programmed cell death-1.

