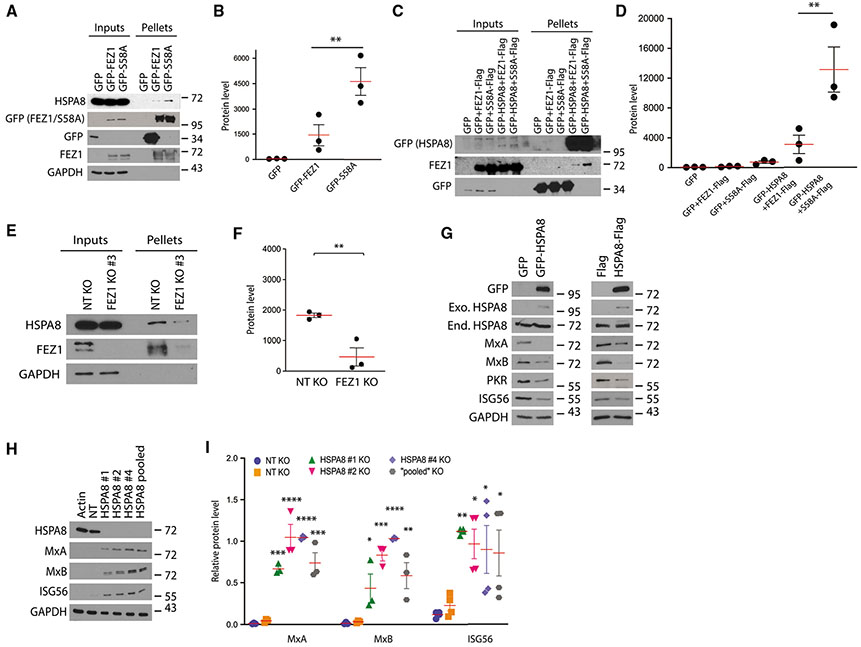
Figure 2. HSPA8 interacts with FEZ1 and regulates ISG expression.
(A) WB confirmation of FEZ1 binding to endogenous HSPA8 in complexes isolated on GFP-TRAP agarose from CHME3s or CHME3s stably expressing GFP control, GFP-FEZ1, or GFP-S58A.
(B) Quantification of HSPA8 levels in protein complexes from (A).
(C) Reciprocal GFP pulldowns from CHME3 lysates expressing GFP or GFP-HSPA8 along with either FEZ1-Flag or S58A-Flag.
(D) Quantification of FEZ1 and FEZ1 S58A levels in protein complexes from (C).
(E) CoIP analysis showing interaction between endogenous FEZ1 and HSPA8 in CHME3 control or FEZ1 KO cells.
(F) Quantification of HSPA8 levels in protein complexes from (E).
(G) Representative WB (n = 2) showing decreases ISG levels in CHME3 expressing either GFP-HSPA8 (left panels) or HSPA8-Flag (right panels). Exo., exogenous; End., endogenous.
(H) KO of HSPA8 (HSPA8 1, 2, or 4, or HSPA8 pooled), but not non-targeting (NT) gRNAs, increases ISG levels in CHME3s.
(I) Quantification of ISG levels relative to HSPA8 in cells from (H). Data are presented as the ratio to the difference between control and treatment groups. A Student’s t test was used in (F) and one-way ANOVA followed by Tukey post-hoc test in (B, D, and I) to calculate statistical significance. (B, D, F, and I) n = 3; red line, mean; bars, SD.
See also Figure S2.

