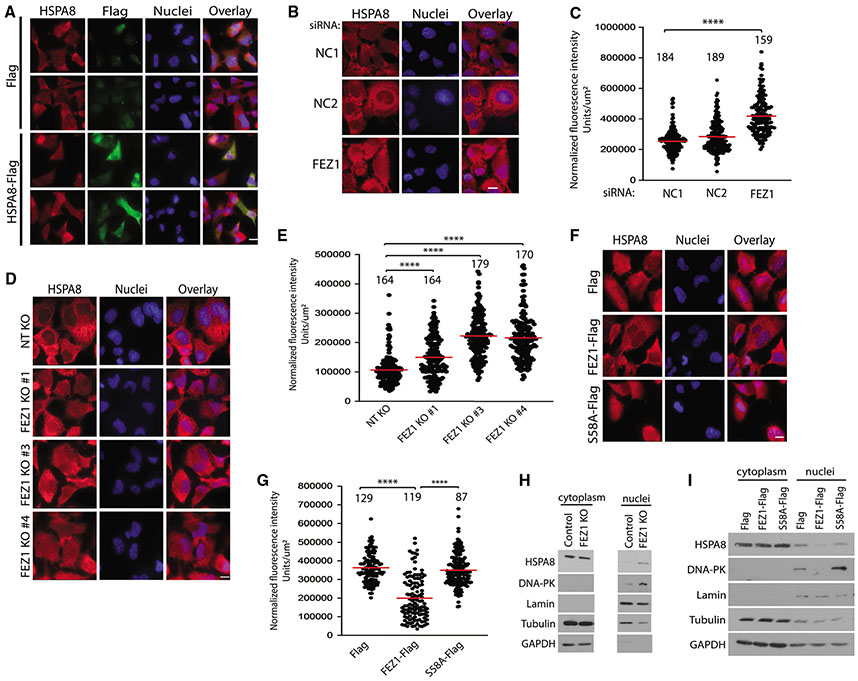
Figure 3. FEZ1 regulates HSPA8 localization.
(A) Representative IF images of CHME3s expressing Flag control or HSPA8-Flag stained for total HSPA8 (red), exogenous HSPA8 (Flag, green), or the nucleus (Hoechst, blue). Scale bar, 10 μm.
(B, D, and F) Representative IF images of intracellular distribution of HSPA8 in either CHME3s treated with two different negative controls (NC1 and NC2) or FEZ1-specific siRNAs (B) or three different FEZ1 KO CHME3 pools (FEZ1 KO 1, 3, and 4) (D), or CHME3 expressing Flag control, FEZ1-Flag, or S58A-Flag (F). Nuclei were stained with Hoechst. Scale bar, 10 μm.
(C, E, and G) Quantitative analysis of HSPA8 staining in nuclei of CHME3s in (B, D, and F), respectively. Number of cells analyzed is indicated, n = 3; red line, mean; bars, SD. One-way ANOVA was used to calculate statistical significance with Tukey (C and G) and Dunnett (E) post-hoc tests.
(H and I) Representative (n = 2) WB analysis of nuclear and cytoplasmic fractions from control and FEZ1 KO CHME3s (cropped to remove irrelevant samples) (H) or Flag, FEZ1-Flag, and S58A-Flag expressing CHME3s (I).
See also Figure S3.

