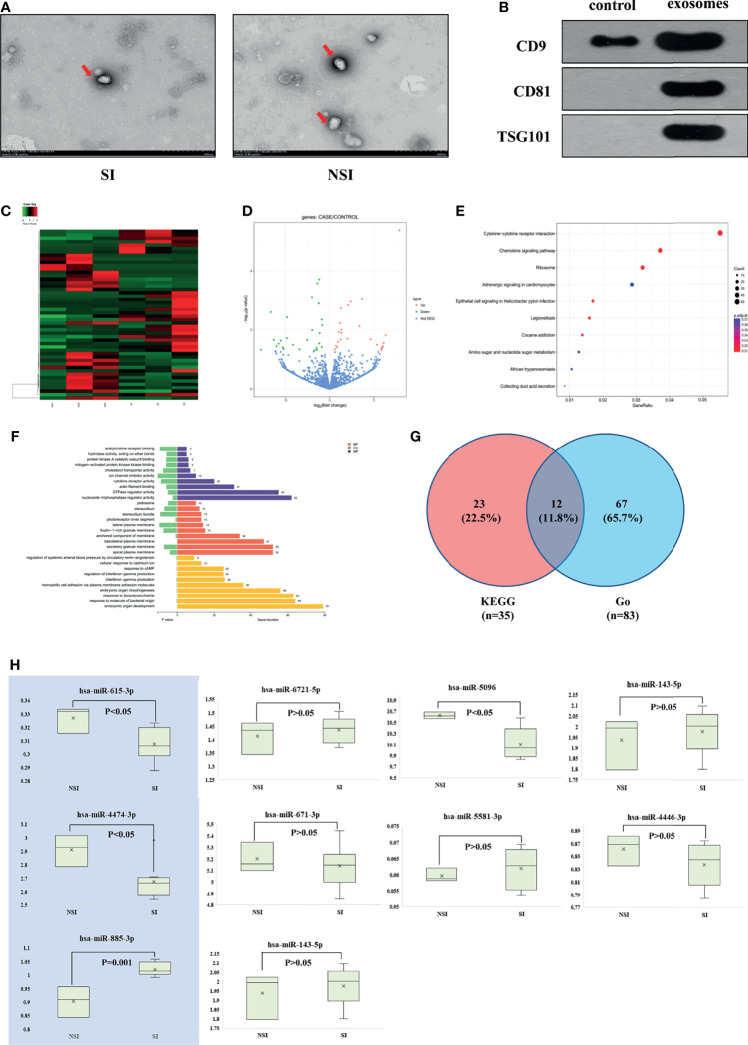
Figure 1.
Screening differentially expressed exosome miRNAs. (A) Transmission electron microscopy of plasma exosomes of the SI and NSI groups. (B) Western blot detected exosome-labeled proteins CD9, CD81, and TSG101. (C) Heat map of the cluster analysis of differentially expressed miRNAs among 6 random samples from the SI and NSI groups. (D) Volcano map of differentially expressed miRNAs among 6 random samples from the SI and NSI groups. (E) Scatter plot of KEGG enrichment in differential exosome miRNA target genes. (F) Bar chart of Go enrichment analysis of differential exosome miRNA target genes. (G) Veen analysis of differential exosome miRNA target genes. (H) PCR results of candidate exosome miRNAs among the remaining samples.

