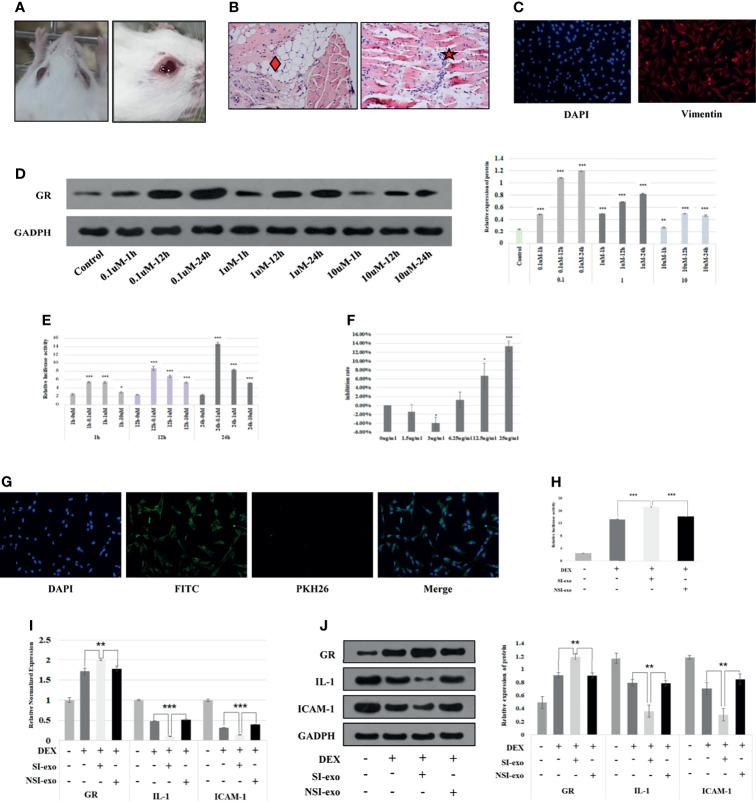
Figure 2.
SI-exo improves the glucocorticoid sensitivity of OFs. (A) Eye pictures of GO mice. (B) HE staining of retrobulbar tissue of GO mice (SP*200); “♦”: fat infiltration; “★”: inflammatory cell infiltration. (C) Results of primary OFs immunofluorescence identification; DAPI: labeling the OF nucleus with blue fluorescence; Vimentin: labeling vimentin with red fluorescence. (D) The Western blot result of the GR protein expression level when OFs in DEX at 0.1, 1, and 10 μM for 1, 12, and 24 h, respectively. Compared with the control group: *p < 0.05; **p < 0.01; ***p < 0.001. (E) The GRE luciferase reporter plasmid activity result when OFs in DEX at 0.1, 1, and 10 μM for 1, 12, and 24 h. Compared with the 0-μM group: *p < 0.05; **p < 0.01; ***p < 0.001. (F) CCK8 results of OFs in exosomes at 1, 1.5, 3, 6.25, 12.5, and 25 μg/ml for 24 h. Compared with the 0-μg/ml group: *p < 0.05; ***p < 0.001. (G) Immunofluorescence results of coculture of plasma exosomes and OFs. DAPI: labeling the OF nucleus with blue fluorescence; PKH26: labeling plasma exosomes with red fluorescence; FITC: labeling cytoskeleton with green fluorescence. (H) Plasmid activity of GRE luciferase reporter gene results in each group. DEX: 0.1 μm DEX-treated OFs for 24 h; SI-exo/NSI-exo: 25 μg/ml SI-exo/NSI-exo-treated OFs for 24 h; *p < 0.05; **p < 0.01; ***p < 0.001. (I) Statistical chart of PCR detection of GR, IL-1, and ICAM-1 mRNA levels in each group. Grouping and statistical methods are the same as (I). (J) Western blot detection of GR, IL-1, and ICAM-1 protein levels and statistical chart in each group. Grouping and statistical methods are the same as (I).

