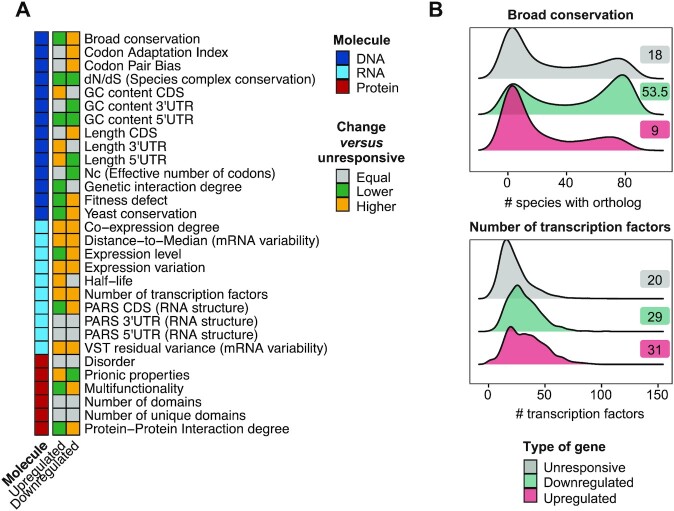
Figure 2.
Stress-responsive genes display different features in all levels of regulation. (A) Heatmap summarizing the results for individual Wilcoxon tests assessing differences between osmostress-responsive and unresponsive genes for the indicated features. Gray indicates features that are unchanged, yellow features that are higher in osmostress-responsive genes, and green features that are higher in osmostress-responsive genes. Features are ordered first by molecular group and then alphabetically. The molecule of regulation to which the feature belongs is shown in the left column. Features related to DNA are indicated in dark blue, RNA in light blue and Protein in red. (B) Density plot shows the distribution of two selected features (broad conservation and number of TFs) for each group of genes. X-axis represents the value of a given feature and Y-axis the kernel density estimate. Labels show the median value of a given feature in each group of genes.

