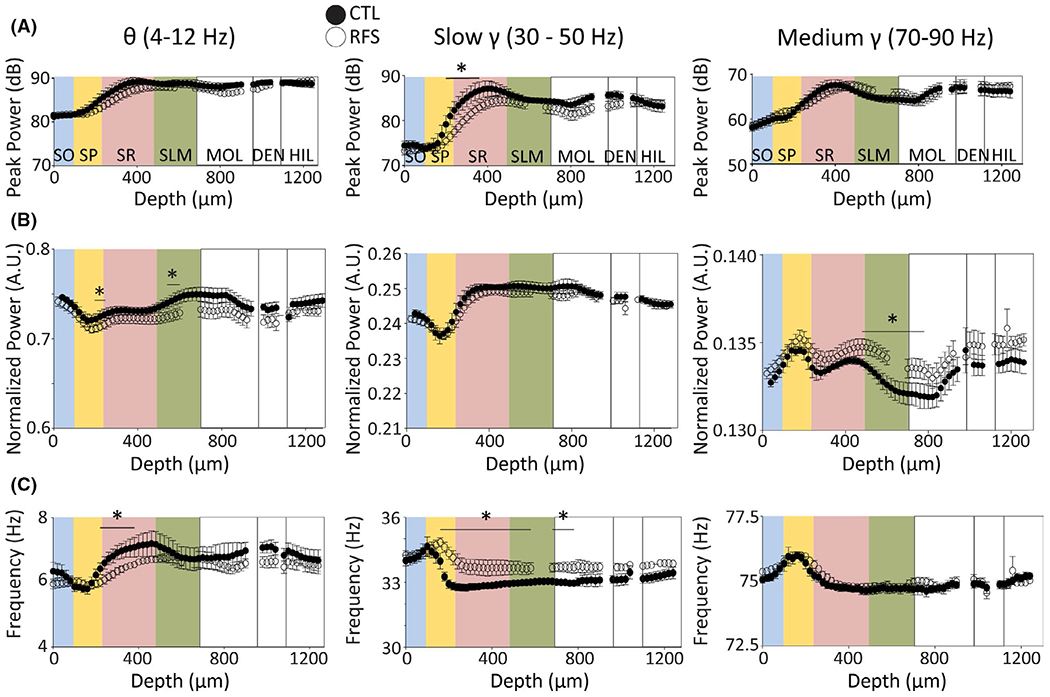
FIGURE 3.

Early life experimental recurrent febrile seizures (eRFSs) alters spectral properties within the theta and gamma bandwidths compared with control (CTL). For all plots, relative CA1 location corresponding to depth is superimposed in colors: blue = stratum oriens (SO), yellow = stratum pyramidale (SP), pink = stratum radiatum (SR), green = stratum lacunosum moleculare (SLM). White = dentate gyrus molecular layer (MOL), dentate gyrus cell layer (DEN), hilus (HIL). For all plots, filled circles = CTL, empty circles = eRFS. (A) Peak power measured in decibels plotted by depth in micrometers for theta (4–12 Hz, left), slow gamma (30–50 Hz, middle), and medium gamma (70–90 Hz, right) bandwidths. (B) Power normalized to the peak shown in arbitrary units (A.U.) plotted against depth for theta (left), slow gamma (middle), and medium gamma (right). (C) Frequency in hertz plotted by depth for theta (left), slow gamma (middle), and medium gamma (right). All statistical analyses were performed using generalized linear models. Statistical significance of p < .05 is denoted by asterisk/horizontal bar over the relevant depth measurements; only significant channel-by-channel group × depth interactions are noted. CTL, n = 5; eRFS, n = 6. eRFSs led to significant changes in expression of theta frequency, slow gamma power and frequency, and normalized medium gamma power throughout CA1 compared with CTL
