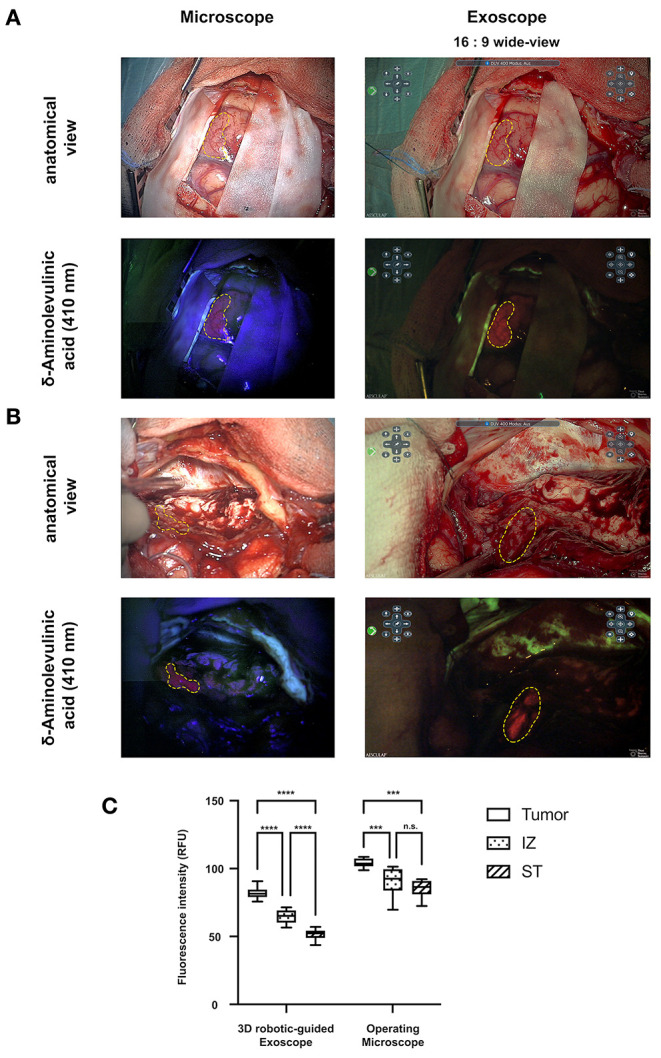
Figure 2.

(A) Side-by-side comparison of work views using the operating microscope and the exoscope. (B) Smaller (two upper rows) and higher (bottom rows) magnification using reflected light and 5-aminolevulinic acid. The picture ratio cor responds to the actual screen size. The dotted line indicates the tumor margin. (C) Mean 5-Ala fluorescence was higher in OM images compared to those from the exoscope. (***P < 0.005, ****P < 0.0001).
