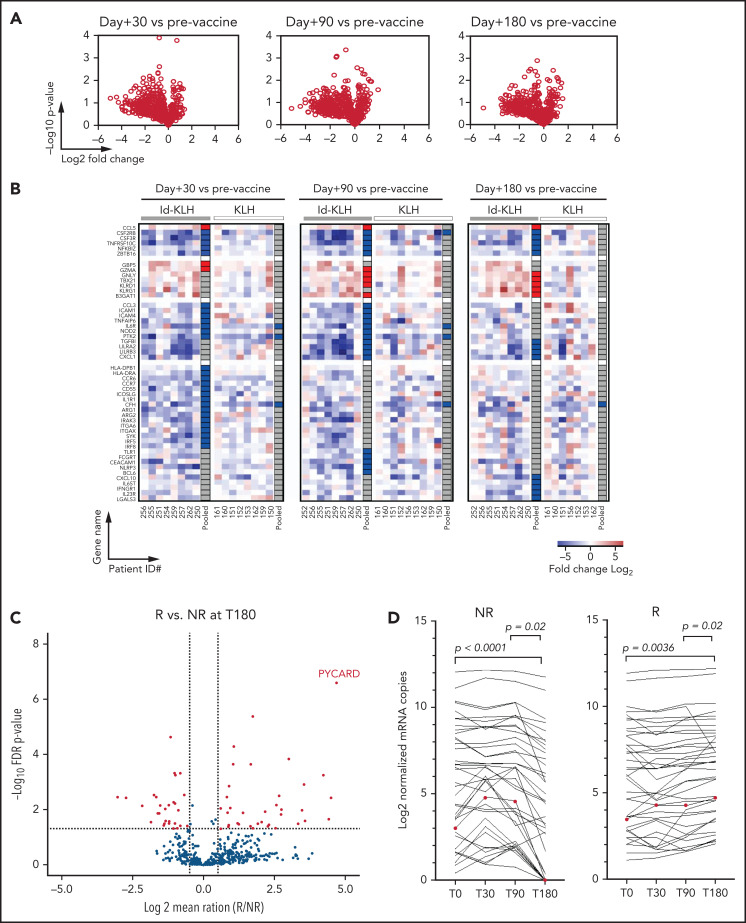
Figure 4.
Differential CD8+ T-cell immune gene expression between patients receiving vaccine and control vaccine and responders (Rs) vs nonresponders (NRs). (A) CD8+ T cells were isolated from PBMCs obtained pre- (T0) and at 3 time points postvaccine (30 [T30], 90 [T90], and 180 [T180] days after activated T-cell infusion) from 16 patients (8 patients treated with Id-KLH and 8 patients treated with KLH control). Gene expression profiling was batched and performed by NanoString, and postvaccine results for each patient were compared against corresponding T0 prevaccine samples. Volcano plots illustrate the log2 FC in gene expression (x-axis) and paired P values from Student t tests between prevaccine (T0) and Id-KLH postvaccine samples (T30, T90, and T180; y-axis). Differentially expressed genes (P < .05 and log2 FC >2 or −0.5 or less) are indicated in red. (B) Heatmap displaying expression of 50 differentially expressed genes, as defined in panel A. Pooled results for all patients are shown for each gene in the column to the far right for each treatment arm. Pooled results are classified as significantly upregulated (red), significantly downregulated (blue), or no significant change (gray). (C) Volcano plot showing the distribution of FCs in gene expression comparing R and NR CD4+ T cells obtained at day +180 postvaccination. Genes with absolute FC >1.5 and adjusted P value false-discovery rate (FDR) <0.05 are indicated in red. (D) Serial expression of 36 differentially upregulated genes expressed between Rs and NRs across T0, T30, T90, and T180 time points. Mean T-cell mRNA expression level for each gene is shown. Differences in the mRNA copy numbers between time points were analyzed using a 2-tailed paired Student t test. Expression levels of the PYCARD gene are indicated in red.

