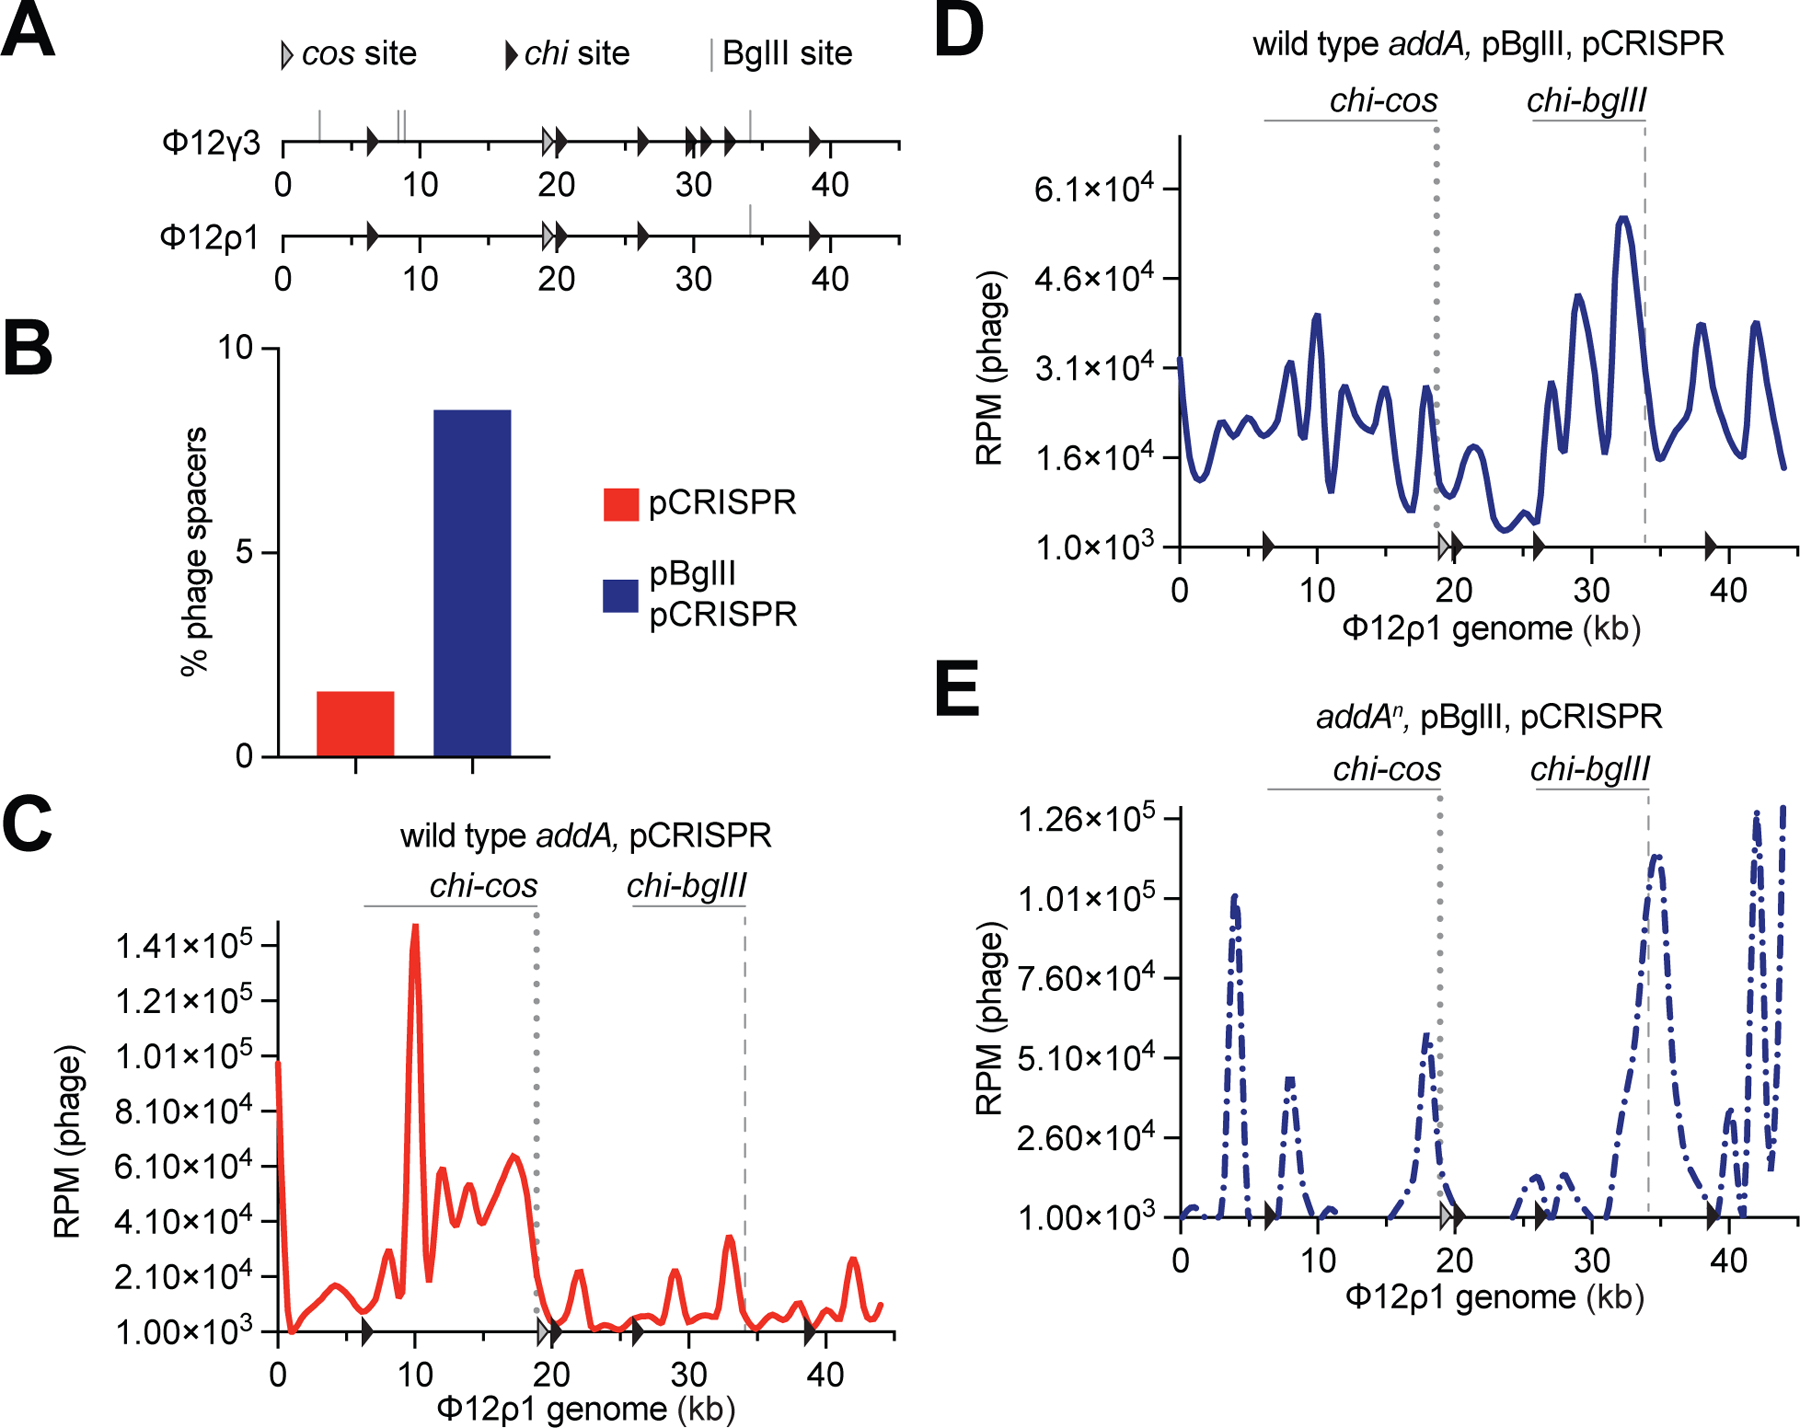
Figure 4. AddAB nuclease activity amplifies the region of spacer acquisition.

(A) Schematic representation of the Φ12γ3 and Φ12ρ1 genomes showing the BglII sites analyzed in this study (grey lines), their chi sites (black arrowheads) and the cos site (white arrowhead). (B) Quantification of phage-derived spacers, relative to total new spacers, acquired 30 minutes after infection of staphylococci harboring pCRISPR in the presence or absence of BglII expression with Φ12ρ1, via NGS of the CRISPR locus. MOI ~25. (C) Distribution of spacer abundance (measured as RPM of phage-matching reads) obtained in (B) across the Φ12ρ1 genome, using data from infection of cells not expressing BglII. (D) Same as (C) using data from infection of cells carrying pBglII. (E) Same as (D) using data from infection of addAn mutant staphylococci. See also Figure S4.
