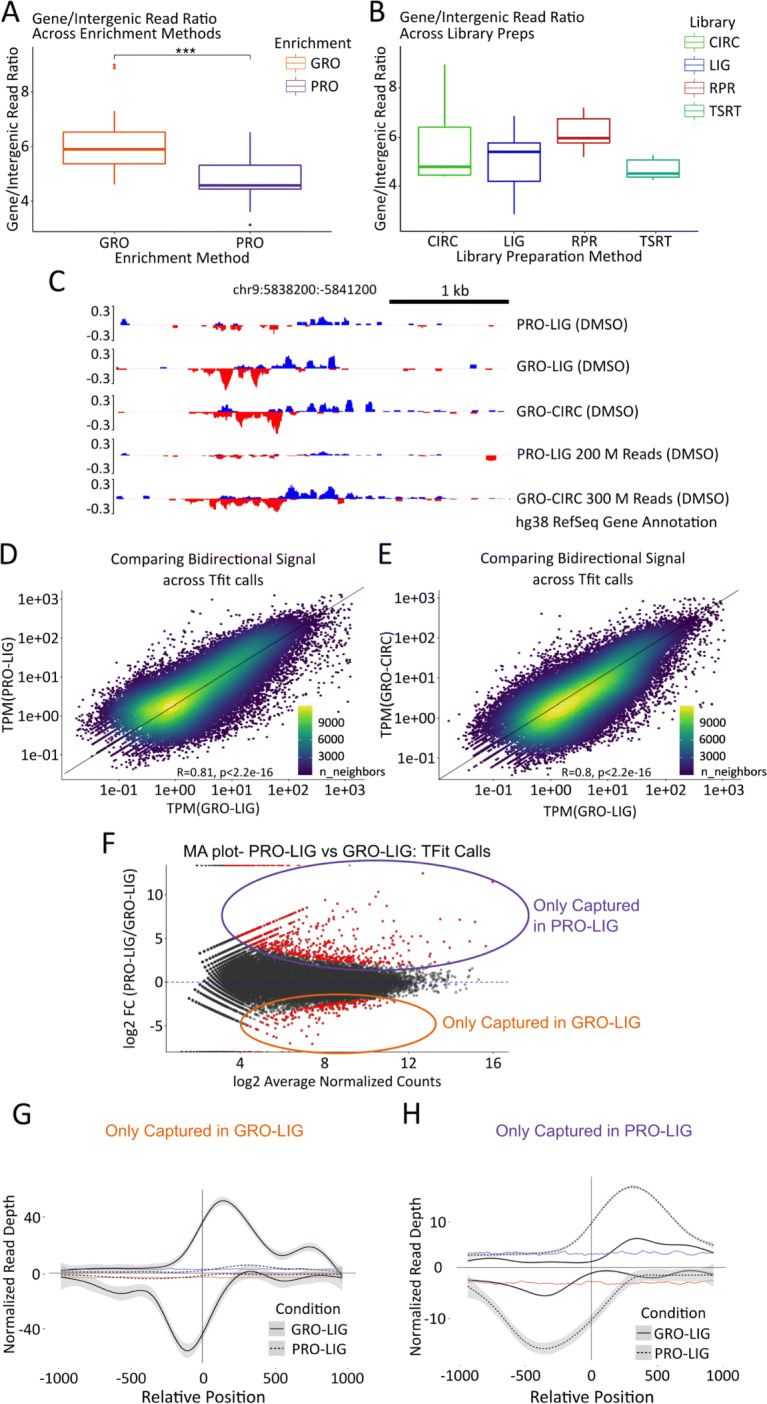
Fig. 4.

Analysis of enhancer elements in multiple datasets. A, B Number of reads counted over RefSeq annotated gene regions divided by the number of reads counted over intergenic (unannotated) regions, for each dataset analyzed. The datasets represented here are all those listed in Supplemental Table 1, including public datasets. Datasets were first analyzed by enrichment method (GRO-seq (n=23) vs. PRO-seq (n=21), p <.01), then by library preparation method (LIG (n=17) vs CIRC (n=10) vs TSRT (n=10) vs RPR (n=7), p >.05). We note that the RPR boxplot includes 3 of our lower quality datasets; however, we chose to include them here owing to the scarcity of RPR datasets in the RO-seq database. These are otherwise excluded from further analysis. C Example section representing disparate representation of reads from our in-house datasets over an enhancer, even at high depths. D, E Scatterplots representing reads over Tfit (enhancer) calls (calls combined by MuMerge, counts normalized by TPM). F MA plot of calls found in (D). Red dots are significant (p <.05). G, H Metagenes of significant hits found in (F). Vertical line indicates the approximated center of the bidirectional transcripts as determined by Tfit. Distance from the center of the bidirectional is in bp, read depth was normalized by counts-per-million (CPM). G Calls that were differentially captured in GRO-LIG (n=1350). Background signal on the plus strand is indicated by the blue trendline, while background signal on the minus strand is indicated by the red trendline. H Calls that were differentially captured in PRO-LIG (n=3050), with the background signal depicted as in panel G
